- Case StudyHelp.com
- Sample Questions
Are You Stuck with Coursework on 7FNCE044W Predictive Analysis for Decision Making? Don’t lose hope; Case Study Help Experts Help with your project within the deadline and at an affordable price. We have subject matter experts around the globe, and we provide Coursework Solutions and Assignment Answers Worldwide.

Question 1
An analyst has the following cross-section data for the United States (US) over the period January 1959 – December 1998:
= interest rate.
= logarithm of money.
= logarithm of prices.
= logarithm of output
The economist aims to analyse the demand for money in the US using a static long-run relationship. Figure 1 depicts the dynamics of the four variables, while STATA output is given in Table 1:
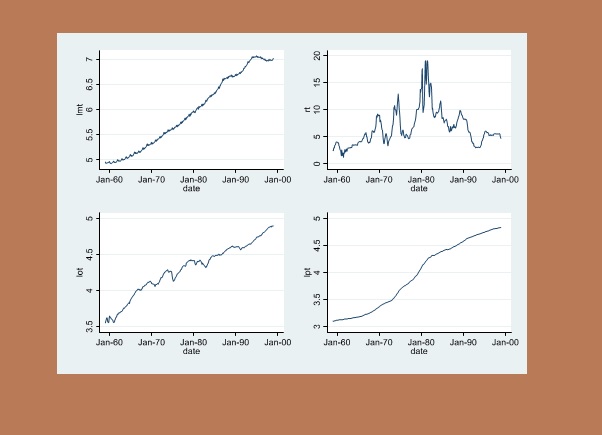
Figure 1
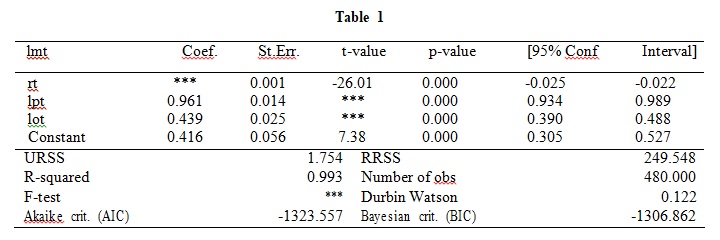
Table 1
Notes:
- URSS and RRSS refer to the Unrestricted Sum of Squared Residuals and the Restricted Sum of Squared Residuals, respectively.
- Use a 5% significance level for all tests.
- State the null and alternative hypotheses, the test statistic to compute and its distribution, all formulas, and the criteria for rejecting or failing to reject the null hypothesis for all tests.
a). Discuss the main statistical properties of the Do they exhibit stationarity? Why? [5 Marks]
b). Write down a mathematical expression describing the true model of the regression estimated in Table 1. What are the main assumptions imposed on this linear model? Discuss the implications of the invalidity of these assumptions. [7 Marks]
c). Interpret the coefficient estimates in Table Perform a (two-tailed) test of individual significance of the parameters of all the variables using the critical value of the corresponding distribution and the test p-value. Interpret the test results. [8 Marks]
d). Explain how you would test for the joint significance of the parameters of all What is your conclusion from this test? Provide an interpretation of the goodness of fit of the model. [5 Marks]
e). The economist formulates a hypothesis that the effect of logarithm output is half the effect of logarithm prices. Perform an F-test for the economist’s hypothesis specifying the null and the equation of the restricted model given that the sum of the squared residuals (RSS) of the restricted model for that test is 760. Interpret the test results. [10 Marks]
f.)
- Define the concept of unit roots. What are the main implications of the presence of a unit in the data on the estimated model in Table 1?
- Describe the steps involved in performing Augmented Dickey-Fuller (ADF)
- Table 2 reports the ADF test for all Discuss the main conclusions of the reported statistics and indicate which variables contain unit roots and which do not (if any). Explain your answer and show all your work. [10 Marks]
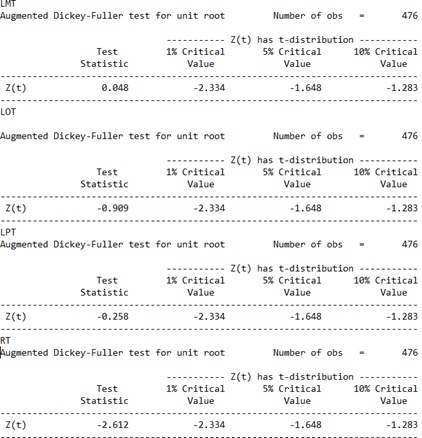 Table 2
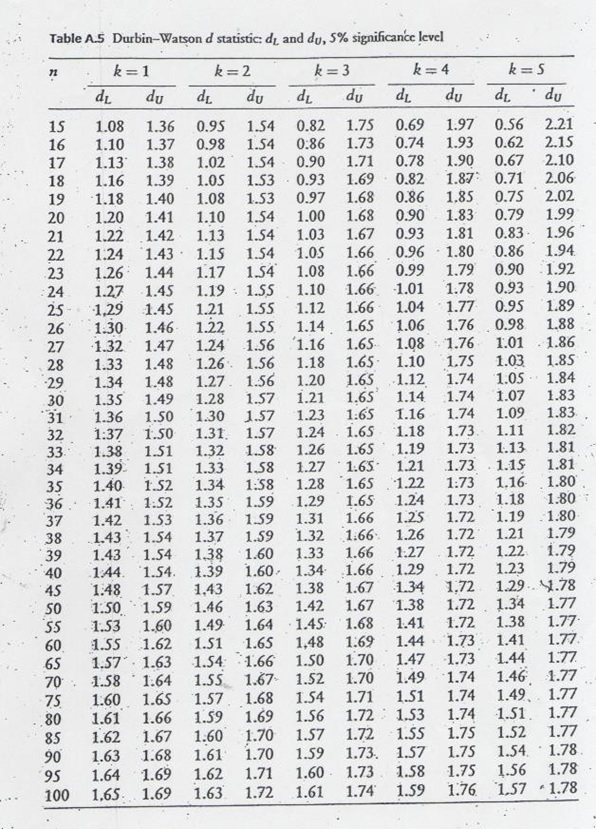
g). Test for the presence of serial correlation in the errors formally using the Durbin Watson What are your conclusions? [5 Marks]
Also Read: 7FNCE044W Predictive Analysis for Decision Making
Question 2
a). Given that ~(0, 2), derive the mean, the variance and the covariances of the following processes:
i. = + 1−1 + 2−2,
where || < 1, = 1, 2 [6 Marks]
ii. = −1 + .
where 0 = 0. [5 Marks]
b). Which of the above series in (b-i) and (b-ii) are weakly stationary and why? [4 Marks]
c). The following regression was run using quarterly data, amounting to 90 observations:
̂ = 0.49 − 0.27 + 0.22
(0.84) (0.27) (0.071)
̅2 = 0.28, = 1.20, LM(2)=7.42
where () is the demand for text books, () is the price of a book and () is the total level of income, all variables are in logarithms (standard errors in parentheses). DW is the Durbin- Watson test for the first order of autocorrelation and LM(2) is the Lagrange Multiplier test for second order autocorrelation.
- Does the above regression suffer from first-order autocorrelation? [4 marks]
- Briefly Describe how you would conduct the LM test Does this model suffers from second-order autocorrelation? [6 marks]
Question 3
a). The following models were fitted to a cross-sectional dataset of 50 firms:
Model 1
̂ = 2.3 + 0.21 − 6.142 − 0.013 + 1.54
(0.052) (1.243) (0.015) (1.324)
2 = 0.40, = 0.60
Model 2
̂ = 2.6 + 0.251 − 6.142
(0.42) (2.98)
2 = 0.30, = 0.70
where y = rate of return on equity for the firm (ROE), x1 = market share, x2 = measure of firm size, x3 = industrial growth rate, x4= level of world trade in industrial products. Numbers in parentheses are coefficient standard errors.
- Based on models 1 and 2, examine the joint hypothesis that the coefficients on x3 and x4 are equal to zero. Describe all steps. (5 Marks)
- Explain how you would test whether financial firms have, on average, higher ROE. (5 Marks)
b). Suppose you wish to test for the presence of ARCH effects in a stock market Explain how you would conduct a test for the presence of the 4th-order ARCH effects. [3 Marks]
c). Using monthly data for , the FTSE100 index, from January 1992 to December 2005, the following set of results were obtained:
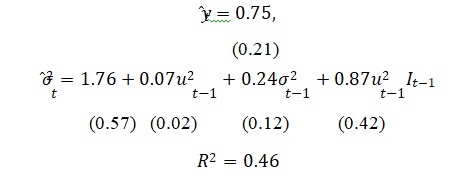
Values in ( ) are the standard errors of the coefficient estimates and −1 = 1 if −1 < 0, −1 = 0 otherwise. −1 is the conditional deviation.
- What role does the final term in the above conditional variance equation serve? [2 Marks]
- What is the interpretation of the estimated value of lagged conditional variance (2 ) −1, 0.24? [5 Marks]
- With reference to the conditional variance equation, if 2 −1= 74, consider that ̂−1 = ±0.5. Estimate the value of 2, for a positive shock (+0.5) and a negative shock (-0.5). [5 Marks]
Distribution Tables
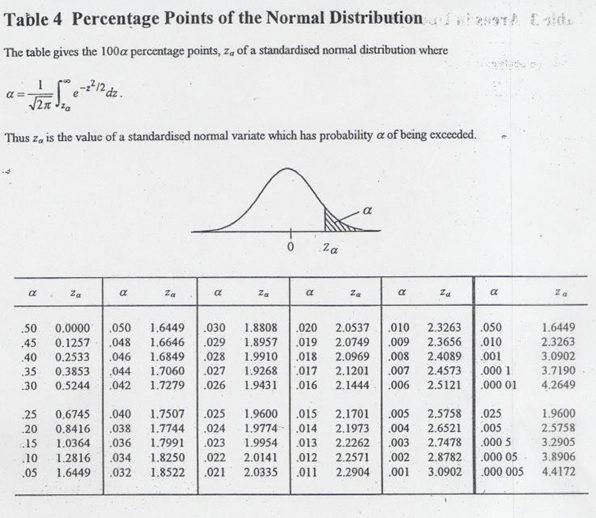
Normal Distribution
Student t Distribution
Chi-Square Distribution
F Distribution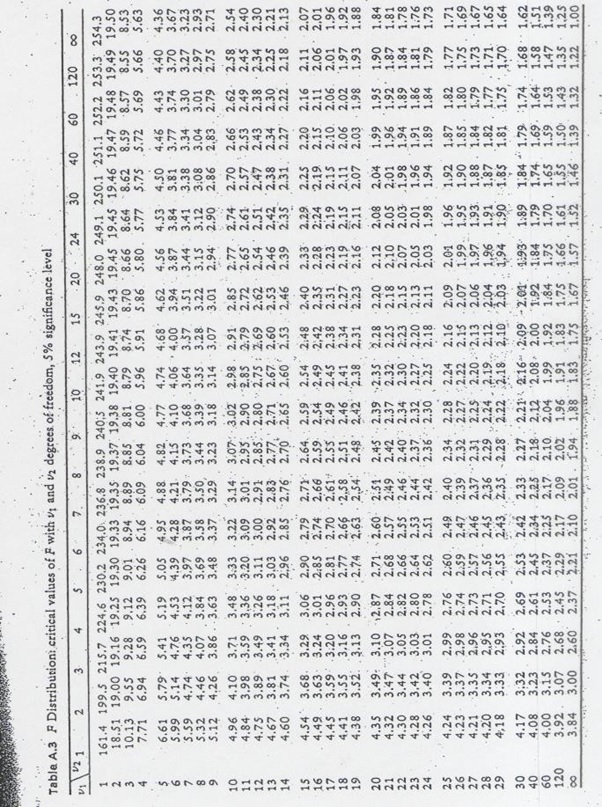
DW d Statistic