

- Case StudyHelp.com
- Sample Questions
Research and Quantitative Methods Assignment Solution
Assignment Detail:-
- Number of Words: 5000
Are you seeking Research and Quantitative Methods Assignment Answer to Question? If yes, then this is the right destination for you. Casestudyhelp.com delivers online assignment help at a cost-effective price. We have a huge base of MBA assignment writers who are well-qualified to provide you with assistance with 100% plagiarism free content. Enjoy the expertise and experience of our knowledgeable experts—we promise excellence at every step!

FORMATIVE ASSESSMENT 2
QUESTION 1
Study the extract below and on the basis of the requirements specified for the proposed study answer all the questions that follow.
Entrepreneurial Context
The starting point for entrepreneurship is what we call an entrepreneurial context. For Steve Jobs and Steve Wozniak, the entrepreneurial context was a computing system in which users were dependent on mainframe computers controlled by a central IT staff who guarded the mainframe like a shrine. Users got their computing tasks done, but only after waiting in line and using the software designed by the IT staff. If users wanted a software program to do something out of the ordinary, they were told to wait six months for the programming to be done.
From the users’ perspective, the experience was inefficient and unsatisfactory. But since the centralized computing model was the only one available, users put up with it and built the delays and inefficiencies into their workflow, resulting in an equilibrium, albeit an unsatisfactory one.
System dynamicists describe this kind of equilibrium as a “balanced feedback loop,” because there isn’t a strong force that has the likely effect of breaking the system out of its particular equilibrium. It is similar to a thermostat on an air conditioner: When the temperature rises, the air conditioner comes on and lowers the temperature, and the thermostat eventually turns the air conditioner off.
The centralized computing system that users had to endure was a particular kind of equilibrium: an unsatisfactory one. It is as if the thermostat were set five degrees too low so that everyone in the room was cold. Knowing they have a stable and predictable temperature, people simply wear extra sweaters, though of course they might wish that they didn’t have to.
Pierre Omidyar and Jeff Skoll identified an unsatisfactory equilibrium in the inability of geographically based markets to optimize the interests of both buyers and sellers. Sellers typically didn’t know who the best buyer was and buyers typically didn’t know who the best (or any) seller was. As a result, the market was not optimal for buyers or sellers. People selling used household goods, for example, held garage sales that attracted physically proximate buyers, but probably not the optimal number or types of buyers. People trying to buy obscure goods had no recourse but to search through Yellow Page directories, phoning and phoning to try to track down what they really wanted, often settling for something less than perfect. Because buyers and sellers couldn’t conceive of a better answer, the stable, yet suboptimal, equilibrium prevailed.
Ann and Mike Moore took note of a subpar equilibrium in parents’ limited options for toting their infants. Parents wishing to keep their babies close while carrying on basic tasks had two options: They could learn to juggle offspring in one arm while managing chores with the other, or they could plop the child in a stroller, buggy, or other container and keep the child nearby. Either option was less than ideal. Everyone knows that new-borns benefit from the bonding that takes place because of close physical contact with their mothers and fathers, but even the most attentive and devoted parents can’t hold their babies continuously. With no other options, parents limped along, learning to shift their child from one hip to the other and becoming adept at “one-armed paper hanging,” or attempting to get their tasks accomplished during naptime.
In the case of Fred Smith, the suboptimal equilibrium he saw was the long-distance courier service. Before FedEx came along, sending a package across country was anything but simple. Local courier services picked up the package and transported it to a common carrier, who flew the package to the remote destination city, at which point it was handed over to a third party for final delivery (or perhaps back to the local courier’s operation in that city if it was a national company). This system was logistically complex, it involved a number of handoffs, and the scheduling was dictated by the needs of the common carriers. Often something would go wrong, but no one would take responsibility for solving the problem. Users learned to live with a slow, unreliable, and unsatisfactory service – an unpleasant but stable situation because no user could change it.
Entrepreneurial Characteristics
The entrepreneur is attracted to this suboptimal equilibrium, seeing embedded in it an opportunity to provide a new solution, product, service, or process. The reason that the entrepreneur sees this condition as an opportunity to create something new, while so many others see it as an inconvenience to be tolerated, stems from the unique set of personal characteristics he or she brings to the situation – inspiration, creativity, direct action, courage, and fortitude. These characteristics are fundamental to the process of innovation.
The entrepreneur is inspired to alter the unpleasant equilibrium. Entrepreneurs might be motivated to do this because they are frustrated users or because they empathize with frustrated users. Sometimes entrepreneurs are so gripped by the opportunity to change things that they possess a burning desire to demolish the status quo. In the case of eBay, the frustrated user was Omidyar’s girlfriend, who collected Pez dispensers.
The entrepreneur thinks creatively and develops a new solution that dramatically breaks with the existing one. The entrepreneur doesn’t try to optimize the current system with minor adjustments, but instead finds a wholly new way of approaching the problem. Omidyar and Skoll didn’t develop a better way to promote garage sales. Jobs and Wozniak didn’t develop algorithms to speed custom software development. And Smith didn’t invent a way to make the handoffs between courier companies and common carriers more efficient and error-free. Each found a completely new and utterly creative solution to the problem at hand.
Once inspired by the opportunity and in possession of a creative solution, the entrepreneur takes direct action. Rather than waiting for someone else to intervene or trying to convince somebody else to solve the problem, the entrepreneur takes direct action by creating a new product or service and the venture to advance it. Jobs and Wozniak didn’t campaign against mainframes or encourage users to rise up and overthrow the IT department; they invented a personal computer that allowed users to free themselves from the mainframe. Moore didn’t publish a book telling mothers how to get more done in less time; she developed the Snugli, a frameless front- or backpack that enables parents to carry their babies and still have both hands free. Of course, entrepreneurs do have to influence others: first investors, even if just friends and family; then teammates and employees, to come work with them; and finally customers, to buy into their ideas and their innovations. The point is to differentiate the entrepreneur’s engagement in direct action from other indirect and supportive actions.
Entrepreneurs demonstrate courage throughout the process of innovation, bearing the burden of risk and staring failure squarely if not repeatedly in the face. This often requires entrepreneurs to take big risks and do things that others think are unwise, or even undoable. For example, Smith had to convince himself and the world that it made sense to acquire a fleet of jets and build a gigantic airport and sorting centre in Memphis, in order to provide next-day delivery without the package ever leaving FedEx’s possession. He did this at a time when all of his entrenched competitors had only fleets of trucks for local pickup and delivery – they certainly didn’t run airports and maintain huge numbers of aircraft.
Finally, entrepreneurs possess the fortitude to drive their creative solutions through to fruition and market adoption. No entrepreneurial venture proceeds without setbacks or unexpected turns, and the entrepreneur needs to be able to find creative ways around the barriers and challenges that arise. Smith had to figure out how to keep investors confident that FedEx would eventually achieve the requisite scale to pay for the huge fixed infrastructure of trucks, planes, airport, and IT systems required for the new model he was creating. FedEx had to survive hundreds of millions of dollars of losses before it reached a cash-flow positive state, and without a committed entrepreneur at the helm, the company would have been liquidated well before that point.
Entrepreneurial Outcome
What happens when an entrepreneur successfully brings his or her personal characteristics to bear on a suboptimal equilibrium? He or she creates a new stable equilibrium, one that provides a meaningfully higher level of satisfaction for the participants in the system. To elaborate on Say’s original insight, the entrepreneur engineers a permanent shift from a lower-quality equilibrium to a higher-quality one. The new equilibrium is permanent because it first survives and then stabilizes, even though some aspects of the original equilibrium may persist (e.g., expensive and less-efficient courier systems, garage sales, and the like). Its survival and success ultimately move beyond the entrepreneur and the original entrepreneurial venture. It is through mass-market adoption, significant levels of imitation, and the creation of an ecosystem around and within the new equilibrium that it first stabilizes and then securely persists.
When Jobs and Wozniak created the personal computer they didn’t simply attenuate the users’ dependence on the mainframe – they shattered it, shifting control from the “glass house” to the desktop. Once the users saw the new equilibrium appearing before their eyes, they embraced not only Apple but also the many competitors who leaped into the fray. In relatively short order, the founders had created an entire ecosystem with numerous hardware, software, and peripheral suppliers; distribution channels and value-added resellers; PC magazines; trade shows; and so on.
Because of this new ecosystem, Apple could have exited from the market within a few years without destabilizing it. The new equilibrium, in other words, did not depend on the creation of a single venture, in this case Apple, but on the appropriation and replication of the model and the spawning of a host of other related businesses. In Schumpeterian terms, the combined effect firmly established a new computing order and rendered the old mainframe-based system obsolete.
In the case of Omidyar and Skoll, the creation of eBay provided a superior way for buyers and sellers to connect, creating a higher equilibrium. Entire new ways of doing business and new businesses sprang up to create a powerful ecosystem that simply couldn’t be disassembled. Similarly, Smith created a new world of package delivery that raised standards, changed business practices, spawned new competitors, and even created a new verb: “to FedEx.”
In each case, the delta between the quality of the old equilibrium and the new one was huge. The new equilibrium quickly became self-sustaining, and the initial entrepreneurial venture spawned numerous imitators. Together these outcomes ensured that everyone who benefited secured the higher ground.
Source: https://www.law.berkeley.edu/php-programs/courses/fileDL.php?fID=7288
REQUIRED:
According to the extract, entrepreneurship is premised on an entrepreneur making sense of a suboptimal equilibrium within an entrepreneurial context, imposing his or her personal characteristics on the suboptimal equilibrium and in the process creating a new stable equilibrium, one that provides a meaningfully higher level of satisfaction for the participants in the system.
As a researcher with a keen interest in business development, you are proposing an exploratory study with the aim of unpacking the linkages between entrepreneurial contexts, characteristics and outcomes. You intend to gather data from successful entrepreneurs in the city of Cape Town.
With an interpretivist stance, you have formulated the following research objectives:
- To unpack how entrepreneurs make sense of a suboptimal equilibrium in an entrepreneurial context;
- To explore how entrepreneurs (un)successfully bring their personal characteristics to bear on a suboptimal equilibrium; and
- To understand the critical factors of the sustainability of entrepreneurial ventures.
Please outline how you would go about conducting the proposed study with reference to the following:
1.1 Formulate a suitable title for the proposed study.
1.2 Specify the aim and significance of the proposed study.
1.3 Formulate THREE (3) research questions that the proposed study will attempt to answer.
1.4 Specify and briefly discuss an appropriate research design for the proposed study, and rationalise the choice of this particular design.
1.5 Based on the design you have chosen above, discuss the research methodology you would follow with regard to:
- Sampling Methodology:
(a) Specify the target population for the proposed study.
(b) Propose a method of sampling for the study and discuss why this method of sampling is fit for the purpose of the study design.
- Method of Data Collection:
What data collection instrument(s) and/or method(s) would you use to collect your data? Provide a rationale for, and justify the appropriateness of, the proposed data collection method(s).
- Method of Data Analysis:
Briefly discuss the method(s) of data analysis that you would use in your study (Please note: you are required to specify and explain, where necessary, the methods of analysis you would employ for each of your research questions in 1.3).
QUESTION 2
Study the note on the use of machine learning (ML) and artificial intelligence (AI) for qualitative analysis below and answer all questions in this section.
By Susie Weller in Guest post
This guest blog post is by Dr Daniel Turner, a qualitative researcher and Director of Quirkos, a simple and visual software tool for qualitative analysis. It is based on collaborative research with Claire Grover, Claire Lewellyn, and the late Jon Oberlander at the Informatics department, University of Edinburgh with Kathrin Cresswell and Aziz Sheikh from the Usher Institute of Population Health Sciences and Informatics, University of Edinburgh. The project was part funded by the Scottish Digital Health & Care Institute.
Can a computer do qualitative analysis?
It seems that everywhere we look researchers are applying machine learning (ML) and artificial intelligence (AI) to new fields. But what about qualitative analysis? Is there a potential for software to help a researcher in coding qualitative data and understanding emerging themes and trends from complex datasets?
Firstly, why would we want to do this? The power of qualitative research comes from uncovering the unexpected and unanticipated in complex issues that defy easy questions and answers. Quantitative research methods typically struggle with these kind of topics, and machine learning approaches are essentially quantitative methods of analysing qualitative data.
However, while machines may not be ready to take the place of a researcher in setting research questions and evaluating complex answers, there are areas that could benefit from a more automated approach. Qualitative analysis is time consuming and hence costly, and this greatly limits the situations in which it is utilised. If we could train a computer system to act as a guide or assistant for a qualitative researcher wading through very large, long or longitudinal qualitative data sets, it could open many doors.
Few qualitative research projects have the luxury of a secondary coder who can independently read, analyse and check interpretations of the data, but an automated tool could perform this function, giving some level of assurance and suggesting quotes or topics that might have been overlooked.
Qualitative research could use larger data sources if a tool could at least speed up the work of a human researcher. While we aim in qualitative research to focus on the small, often this means focusing on a very small population group or geographical area. With faster coding tools we could design qualitative research with the same resources that samples more diverse populations to see how universal or variable trends are.
It also could allow for secondary analysis: qualitative research generates huge amounts of deep detailed data that is typically only used to answer a small set of research questions. Using ML tools to explore existing qualitative data sets with new research questions could help to get increased value from archived and/or multiple sets of data.
I am also very excited about the potential for including wider sources of qualitative data in research projects. While most researchers go straight to interviews or focus groups with respondents, analysing policy or media on the subject would help gain a better understanding of the culture and context around a research issue. Usually this work is too extensive to systematically include in academic projects, but could increase the applicability of research findings to setting policy and understanding media coverage on contentious issues.
With an interdisciplinary team from the University of Edinburgh, we performed experiments with current ML tools to see how feasible these approaches currently are. We tried three different types of qualitative data sets with conventional ‘off-the- shelf’ Natural Language Processing tools to try and do ‘categorisation’ tasks where researchers had already given the ‘topics’ or categories we wanted extracts on from the data. The software was tasked with assessing which sentences were relevant to each of the topics we defined. Even in the best performing approach there was only an agreement rate of ~20% compared to how the researchers had coded the data. However, this was not far off the agreement rate of a second human coder, who was not involved with the research project, did not know the research question, just the categories to code into. In this respect, the researcher was put in the same situation as the computer.
The core challenge comes from the relatively small size of qualitative data sets. ML algorithms work best when they have thousands, or even millions of sources to identify patterns in. Typical qualitative research projects may only have a dozen or less sources, and so the approaches give generally weak results. However, the accuracy of the process could be improved, especially by pre-training the model with other related datasets.
There are also limitations to the way the ML approaches themselves work – for example, there is no way at the moment to input the research questions into the software. While you can provide a coding framework of topics you are interested in (or get it to try and guess what the categories should be) you cannot explain to the algorithm what your research questions are, and so what aspects of the data is interesting to you. ML might highlight how often your respondents talked about different flavours of ice cream, but if your interest is in healthy eating this may not be very helpful.
Finally, even when the ML is working well, it is very difficult to know why: ML typically does not create a human-readable decision tree that would explain why it made each choice. In deep learning approaches, where the algorithm is self-training, the designers of the system cannot see how works, creating a ‘black box’. And this is problematic because we cannot see their decision-making process, and tell if a few unusual pieces of data are skewing the process, or if it is making basic mistakes like confusing the two different meanings of a word like ‘mine’.
There is a potential here for a new field: one which meets the quantitative worlds of big data with the insight from qualitative questions. It is unlikely that these tools will remove the researcher and their primary role in analysis, and there will always be problems and questions that are best met with a purely manual qualitative approach. However, for the right research questions and data sets, it could open the door to new approaches and even more nuanced answers.
Source: https://bigqlr.ncrm.ac.uk/2018/08/14/guest-post-17-dr-daniel-turner-can-a-computer-do-qualitative-analysis/
2.1 Based on the note above, what are the current challenges of manual qualitative analysis?
2.2 Based on the note above, critically discuss the potential advantages of using ML and AI in qualitative analysis. In your discussion, highlight SIX (6) potential benefits of ML and AI approaches to business research.
2.3 Based on the note above, critically discuss the current challenges with ML and AI approaches to qualitative analysis. In your discussion, highlight SIX (6) challenges and limitations of ML and AI approaches.
QUESTION 3
Study the caselet below and answer all questions in this section.
An investment analyst is conducting a study with the aim of examining the relationship between working capital management and the profitability of retail sector companies listed on the Johannesburg stock exchange (JSE).
After reviewing the literature, he noted that cash conversion cycle (CCC) has been consistently used as a reliable measure of the aggressiveness of working capital policy by many researchers (Ali & Hassan, 2010; Garg & Gumbochuma, 2015). The reliability of CCC as a measure of working capital management is generally motivated by the fact that CCC is derived from the three constituent components of working capital – inventory conversion period, debtors collection period and creditors payment period.
Suspecting that the proximity between operating profit and operating assets may be important for correlation, he decided that working capital policy should be proxied by CCC and profitability, by operating profit margin (OPM). Accordingly, using secondary data extracted from the published annual reports of 30 JSE-listed retail sector companies (i.e., consumer services and consumer goods companies), he measured the OPM and the CCC of the companies over the period 2015- 2019. The reason for the chosen JSE-listed companies was primarily due to the reliability and availability of financial data. The excerpt of the data collected is depicted in Table 3.1, below.
Table 3.1: Excerpt of data on cash conversion cycle and operating profit margin of JSE-listed retail sector companies
| Observations | Cash conversion cycle (days) | Operating profit margin (%) |
| 1 | -22 | 12 |
| 2 | -17 | 13 |
| 3 | 26 | 5 |
| 4 | -32 | 14 |
| 5 | -25 | 12 |
| 6 | -21 | 18 |
| 7 | 22 | 7 |
| 8 | -27 | 16 |
| 9 | -32 | 15 |
| … | … | … |
| 150 | -31 | 12 |
The analyst used IBM SPSS Statistics 25 for the data analysis and the output in Figure 3.1 to Figure 3.4 was generated.
Figure 3.1: Scatterplot of Profitability (OPM) vs. Cash conversion cycle (CCC)
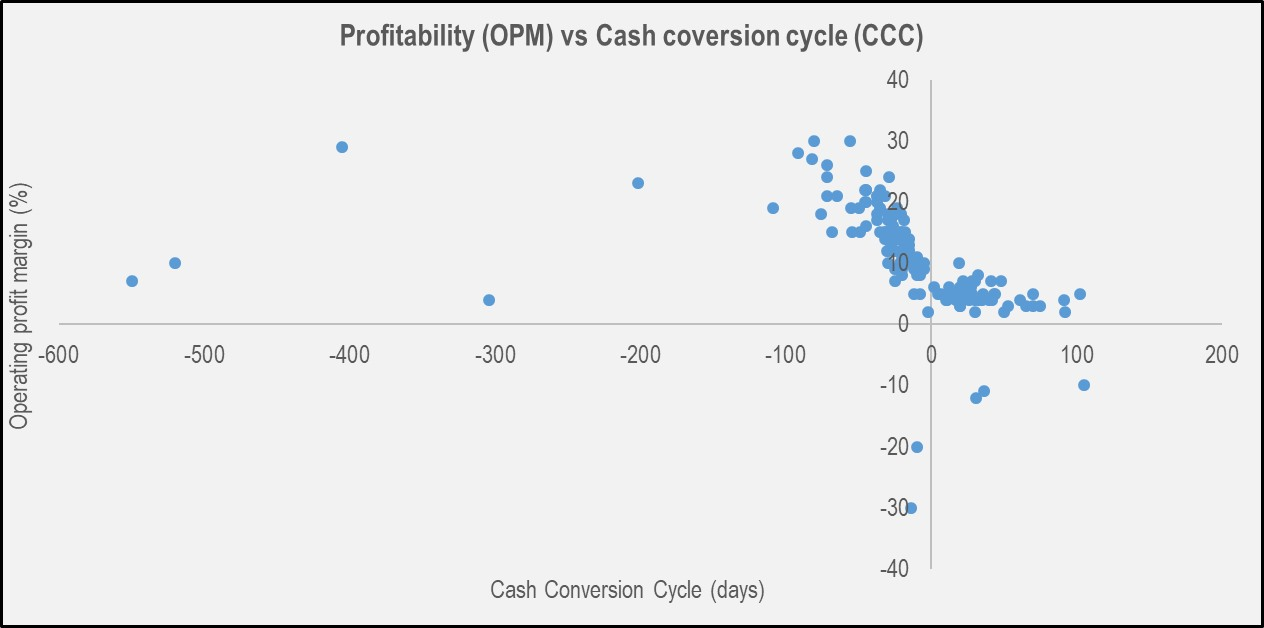
Figure 3.2: Model Summary of Working capital management – Profitability Model
Model Summary b
| Model R | R Square | Adjusted R Square | Std. Error of the Estimate | |
| 1 | .376a | .141 | .135 | 8.093 |
a. Predictors: (Constant), Cash_conversion_cycle
b. Dependent Variable: Operating_profit_margin
Figure 3.3: Results of ANOVA for the Working capital management – Profitability Model
ANOVAa
| Model Sum of Squares | df | Mean Square | F | Sig. | ||
| 1 | Regression | 1591.80 | 1 | 1591.80 | 24.306 | .000b |
| Residual | 9692.39 | 148 | 65.49 | |||
| Total | 11284.19 | 149 | ||||
a. Dependent Variable: Operating_profit_margin
b. Predictors: (Constant), Cash_conversion_cycle
Figure 3.4: Regression coefficients for the Working capital management – Profitability Model
Coefficientsa
| Unstandardized Coefficients | Standardized Coefficients
Beta |
t |
Sig. |
|||
| Model B | Std. Error | |||||
| 1 | (Constant) | 9.848 | .678 | 14.528 | .000 | |
| Cash_conversion_cycle | -.039 | .008 | .376 | -4.930 | .000 | |
a. Dependent Variable: Sales
3.1 Formulate a suitable title for the study.
3.2 Specify the independent variable (IV) and dependent variable (DV) used in the study.
3.3 Formulate the null and alternative hypotheses for the study.
3.4 Using the standard reporting format, provide a comprehensive interpretation of the statistical output provided.
3.5 Rationalise the low goodness of fit of the regression model and discuss the critical role of the literature review in crafting a research design that would yield a higher goodness of fit.
3.6 State the linear regression equation of the relationship between working capital management and the profitability of retail sector companies listed on the Johannesburg stock exchange.
QUESTION 4
Read the following case and answer ALL questions that follow.
Many management decision theories tend to highlight the role of uncertainty and complexity in a normative framework (Harvett, 2013; Degan, 2013). However, a lot still remains unknown about how decision makers make sense of the reality of uncertainty and complexity in problem-solving, and consequently how such perceptions inform different approaches to decision-making. Sensemaking is a process of engaging with complex and dynamic environments that provides organisations and their leaders with a flexible and agile model of the world (Marshall, 2016).
At a fundamental level, the dynamics of managerial sensemaking of complexity and uncertainty are yet to be explored. The distance between rationality and behaviour is bridged by the concept of decision. A decision is essentially the process of settling on a choice and “rationality is a criterion used in the decision that is theoretically grounded on the presupposition that the decision makers are intendedly rational” (Barros, 2010: 57). Ultimately, a company’s value is just the sum of the decisions it makes and executes (Blenko, Mankins & Rogers, 2010: 56).
Research further suggests that demographically and culturally diverse teams draw from a broader mix of experiences, attitudes, cultures, worldviews, social perspectives and perceptibilities, and personalities, and can offer different strategic interpretations of complex and uncertain situations. Thus, dissimilar team members’ sensemaking contributes to better decision outcomes and firm performance (Waldeck, 2007: 42; Rouleau & Balogun, 2010:953).
Mr H. Modise, a business researcher, is conducting a study with the aim of investigating the relationship between managerial sensemaking of uncertainty and complexity and business performance. Using a case study of thirty technology firms in the city of Johannesburg, he has formulated the following sets of null and alternative hypotheses to answer three research questions:
Hypothesis 1:
H0: Management team diversity has no significant impact on organisational sensemaking capacity.
H1: Management team diversity has a significant impact on organisational sensemaking capacity.
Hypothesis 2:
H0: Management team diversity has no significant impact on business performance.
H1: Management team diversity has a significant impact on business performance.
Hypothesis 3:
H0: The ability to make sense of complexity is independent of managerial experience.
H1: The ability to make sense of complexity is independent of managerial experience.
4.1 Specify the aim of Mr Modise’s study.
4.2 Formulate the THREE (3) research objectives and the THREE (3) research questions of Mr Modise’s study.
4.3 A colleague of Mr Modise has questioned why the background information on the study refers to ‘uncertainty’; however, no consideration was given to ‘uncertainty’ in the statements of hypotheses. Thus, to achieve the aim of the study, he has recommended that an additional hypothesis should be framed around management sensemaking of uncertainty and business performance.
In this regard, formulate an additional set of null and alternative hypotheses that for the study.
4.4 The research instrument developed by Mr Modise for the study is depicted below:
(a) State the level of measurement of Part B and Part E of the questionnaire.
(b) Identify the main problem with part A of the questionnaire.
(c) Specify three different statistical tests that Mr Modise could use for testing each of the three hypotheses stated in 4.2. For each statistical test, provide a rationale for your choice and the assumptions that must be met.
QUESTION 5
Study the case and statistical output below and answer the questions that follow:
Employees’ turnover is a global concern, which if not handled well can harm the productivity of an organisation. This is particularly true for the health sector in developing countries. The high turnover rate of health care workers critically affects the health system, particularly in countries with limited resources.
As part of an effort to determine whether turnover intentions of health care workers differ across the three hospitals under the management of Fidelity Health Group, a health management group, the human resources manager wants to evaluate whether staff satisfaction scores differ across the three private hospitals in Johannesburg, Cape Town and Durban. Table 5.1 is an excerpt of staff satisfaction scores measured across the three hospitals (30 employees including doctors, nurses, physiotherapist, radiographers were randomly selected at each hospital).
Table 5.1: Excerpt of staff satisfaction scores across the three hospital
| Employee satisfaction scores at the three hospitals in: | ||
| Johannesburg | Cape Town | Durban |
| 75 | 66 | 39 |
| 55 | 64 | 51 |
| 69 | 57 | 58 |
| 84 | 70 | 64 |
| 67 | 56 | 50 |
| 54 | 52 | 52 |
| 77 | 57 | 57 |
| 66 | 49 | 63 |
| 68 | 72 | 64 |
| … | … | … |
| 71 | 55 | 66 |
A data analyst generated the output in Figure 5.1 to Figure 5.4, below, using IBM SPSS Statistics 25.
Figure 5.1: Case Processing Summary
|
Employee_satisfaction_score |
Valid | Missing | Total | ||||
| Hospitals N | Percent | N | Percent | N | Percent | ||
| Johannesburg | 30 | 100.0% | 0 | 0.0% | 30 | 100.0% | |
| Cape_Town | 30 | 100.0% | 0 | 0.0% | 30 | 100.0% | |
| Durban | 30 | 100.0% | 0 | 0.0% | 30 | 100.0% | |
Figure 5.2: Descriptives
Employee_satisfaction_score
|
N |
Mean |
Std. Deviation |
Std. Error |
95% Confidence Interval for Mean |
Minimum |
Maximum |
||
| Lower Bound | Upper Bound | |||||||
| Johannesburg | 30 | 66.9000 | 12.17502 | 2.22284 | 62.54323 | 71.25677 | 45 | 92 |
| Cape_Town | 30 | 60.2333 | 10.02990 | 1.83120 | 56.64418 | 63.82249 | 43 | 84 |
| Durban | 30 | 56.0333 | 9.20076 | 1.67982 | 52.74088 | 59.32578 | 39 | 74 |
| Total | 90 | 61.0556 | 11.35372 | 1.19679 | 58.70985 | 63.40126 | 39 | 92 |
Figure 5.3: ANOVA
Employee_satisfaction_score
| Sum of Squares | df | Mean Square | F | Sig. | |
| Between Groups | 1801.689 | 2 | 900.844 | 8.104 | .001 |
| Within Groups | 9671.033 | 87 | 111.161 | ||
| Total | 11472.722 | 89 | |||
Figure 5.4: Multiple Comparisons
Dependent Variable: Employee_satisfaction_score Tukey HSD
| Mean
(I) Hospitals (J) Hospitals Difference (I-J) |
Std. Error |
Sig. |
95% Confidence Interval | |||
| Lower Bound | Upper Bound | |||||
| Johannesburg | Cape_Town | 6.6667* | 1.92494 | .024 | 2.8938 | 10.4396 |
| Durban | 10.8667* | 1.92494 | .000 | 7.0938 | 14.6396 | |
| Cape_Town | Johannesburg | -6.6667* | 1.92494 | .024 | -10.4399 | -2.8938 |
| Durban | 4.2000 | 1.92494 | .096 | .4271 | 7.9729 | |
| Durban | Johannesburg | -10.8667* | 1.92494 | .000 | -14.6396 | -7.0938 |
| Cape_Town | -4.2000 | 1.92494 | .096 | -7.9729 | -.4271 | |
*. The mean difference is significant at the 0.05 level.
5.1 Formulate the null and alternative hypotheses for the evaluation by the human resources manager.
5.2 Discuss the importance of the assumptions of normality and the homogeneity of the variances to the validity of the findings from the study.
5.3 Identify the TWO (2) main statistical tests employed in the data analysis and justify their appropriateness for the research problem.
5.4 Provide a comprehensive interpretation of the output of the data analysis. Your interpretation should adhere to the standard reporting format.
For REF… Use: #getanswers2002458
