

- Case StudyHelp.com
- Sample Questions
Statistical Techniques in Business Management Assignment Solution
Are you seeking for Statistical Techniques in Business Management Answers to Homework Questions? At casestudyhelp.com our experts will be happy to provide them with complete business communication homework help and business management homework help. Our experts are available round the clock at students’ disposal.

SECTION A
Based on the information provided below, answer questions 1 to 6.
The average monthly expenditure (in Rand) on fuel to power domestic generators by 20 randomly selected Johannesburg-based households is shown in the Table A below.
Table A: average monthly expenditure (in Rand) on fuel to power domestic generators by 20 households
| 3 000 | 1 500 | 2 000 | 2 500 | 1 800 | 1 100 | 3 900 | 2 300 | 2 100 | 1 600 |
| 2 900 | 1 400 | 1 800 | 2 200 | 1 900 | 3 800 | 3 600 | 3 100 | 2 700 | 1 800 |
QUESTION 1
Using the raw data provided in Table A, above, determine the measures of central tendency.
- The mean, median and mode of the data in Table A are: R2 335, R2 150, and R1800
- The mean, median and mode of the data in Table A are: R2 350, R2 100, and R1800
- The mean, median and mode of the data in Table A are: R2 335, R2 200, and R1800
- The mean, median and mode of the data in Table A are: R2 350, R2 150, and R1800
QUESTION 2
Using the raw data provided in Table A, above, determine the standard deviation and variance of the monthly fuel expenditure of the 20 households.
- The standard deviation and variance of the monthly fuel expenditure of the 20 households are R606 158 and 38
- The standard deviation and variance of the monthly fuel expenditure of the 20 households are R606 158 and 78
- The standard deviation and variance of the monthly fuel expenditure of the 20 households are R661 579 and 38
- The standard deviation and variance of the monthly fuel expenditure of the 20 households are R661 579 and 78
QUESTION 3
The distribution of the monthly fuel expenditure of the 20 households provided in Table A, above, is————— –.
- symmetric
- normal
- negatively skewed
- positively skewed
QUESTION 4
Assuming 6 classes of equal width, which of the following is the optimal class width for a frequency distribution of the monthly fuel expenditure data in Table A, above?
- R1000
- R300
- R500
- R400
QUESTION 5
The ogive curve below represents the monthly fuel expenditure of the 20 households provided in Table A, above.
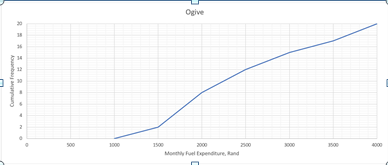
Using the ogive, estimate the median monthly fuel expenditure of the 20 households who were surveyed.
- A. R2 250
- R2 150
- R3 050
- The median monthly fuel expenditure of the 20 households is indeterminable from the ogive.
QUESTION 6
The Histogram below represents the monthly fuel expenditure of the 20 households provided in Table A, above.
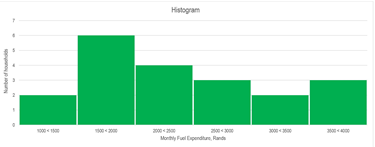
Using the histogram, estimate the modal monthly fuel expenditure of the 20 households who were surveyed.
- R2 000
- R1 550
- R1 450
- R1 830
SECTION B
Use the information provided below to answer questions 7 to 8.
At the conclusion of a recent survey study, a researcher determined that only 25% of individuals who were contacted telephonically provided reliable information.
QUESTION 7
Suppose that 10 of the interviewees are randomly drawn from the sample frame, what is the probability that at least two provided reliable information?
- 0.2440
- 0.7560
- 0.2816
- 0.7184
QUESTION 8
Suppose that 10 of the interviewees are randomly drawn from the sample frame, what is the probability that at most two provided reliable information?
- 0.4693
- 0.4744
- 0.5256
- 0.5307
Use the information provided below to answer questions 9 and 11.
A private hospital stocks a “code blue” resuscitation kit that has a normally distributed demand during the reorder period. The mean (average) demand during the reorder period is 350 kits, and the standard deviation is 10 kits.
QUESTION 9
What is the probability that during the reorder period, the demand for the “code blue” resuscitation kits oscillated between 329 and 375 kits?
- A. 0.9759
- 0.0241
- 0.4821
- 0.4938
QUESTION 10
What is the probability that on a particular day during the reorder period, the demand for the “code blue” resuscitation kits exceeded 373 kits?
- A. 0.1026
- 0.0179
- 0.0107
- 0.2775
QUESTION 11
Suppose that the hospital administrator wants to follow a policy that results in stockouts only 10% of the time. What safety stock of the “code blue” resuscitation kit should the hospital maintain?
- Approximately 363 kits
- Approximately 13 kits
- Approximately 337 kits
- Approximately 36 kits
SECTION C
Study the information provided below and answer questions 12 to 16.
The data in Table C below represents a portfolio of five shares held by an individual investor at the end of the 2010 and 2020 fiscal years.
| Share Code | 2010 | 2020 | ||
| Price of share, R | Number of shares held, Units | Price of share, R | Number of shares held, Units | |
| SPP | 50 | 500 | 210 | 800 |
| ANH | 180 | 200 | 150 | 300 |
| BVT | 15 | 100 | 85 | 1000 |
| AGL | 300 | 200 | 398 | 600 |
| BHG | 70 | 400 | 50 | 200 |
QUESTION 12
According to Laspeyres Price Index,—————– between 2010 and 2020.
- the value of the portfolio increased by approximately 53%
- the number of shares in the portfolio decreased by approximately 09%
- the value of the portfolio increased by approximately 46%
- the number of shares in the portfolio decreased by approximately 33%
QUESTION 13
According to Paasches Quantity Index,—————– between 2010 and 2020.
- the value of the portfolio increased by approximately 53%
- the number of shares in the portfolio increased by approximately 93%
- the value of the portfolio decreased by approximately 46%
- the number of shares in the portfolio decreased by approximately 33%
QUESTION 14
According to Laspeyres Quantity Index,—————— between 2010 and 2020.
- the value of the portfolio increased by approximately 53%
- the number of shares in the portfolio decreased by approximately 09%
- the value of the portfolio increased by approximately 46%
- the number of shares in the portfolio increased by approximately101.33%
QUESTION 15
According to Paasches Price Index,—————– between 2010 and 2020.
- the value of the portfolio increased by approximately 53%
- the number of shares in the portfolio increased by approximately 33%
- the value of the portfolio decreased by approximately 46%
- the number of shares in the portfolio decreased by approximately 224.93%
QUESTION 16
Which of the following statements about the behaviour of the portfolio of shares during the 2010 – 2020 period is patently false?
- The Paasche indices exceed the Laspeyres indices, indicating that the weighted price and weighted quantity changes are positively
- In real terms, the increase in the value of the share portfolio was most probably between 53% and 80.46%.
- In the main, the individual investor bought more shares that appreciated in value and sold some shares that lost value during the 2010 – 2020
- The Laspeyres indices exceed the Paasche indices, indicating that the weighted price and weighted quantity changes are positively
SECTION D
Based on the information provided below, answer questions 17 to 21.
A business researcher with a keen interest in micro, small and medium enterprises (MSMEs) is investigating the relationship between the average annual sales and average annual earnings of 20 MSMEs in the Western Cape province described as ‘the most resilient during the Covid-19 pandemic’ in a recent article. Table D, below, shows the data collected from the 20 MSMEs for the 2020 – 2022 period.
Table D: Average annual sales and average annual earnings of 20 MDMEs in the Western Cape Province for the 2020 – 2022 period.
| # MSME | 1 | 2 | 3 | 4 | 5 | 6 | 7 | 8 | 9 | 10 | 11 | 12 | 13 | 14 | 15 | 16 | 17 | 18 | 19 | 20 |
| Average annual sales, R millions | 89,2 | 19,3 | 18,2 | 71,7 | 58,7 | 46,8 | 17,5 | 11,9 | 20 | 51,2 | 28,9 | 69,2 | 32,4 | 62,3 | 25,4 | 39,6 | 78,3 | 81,2 | 55,9 | 41,1 |
| Average annual earnings, Rmillions | 11,4 | 4,5 | 1,3 | 8 | 6,6 | 5,1 | 2,6 | 1,7 | 3,5 | 8,2 | 4,4 | 12,8 | 3,4 | 7,3 | 4,6 | 5,5 | 10,3 | 10,5 |
7,6 |
5,2 |
QUESTION 17
As part of the preliminary analysis of the data provided in Table D, the researcher produced the scatter plot below.
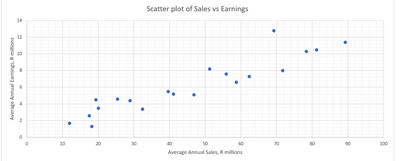
Which THREE of the following assumptions are inferable or discernible from the scatter plot?
- Whether the sample of 20 MSMEs is representative of the population of MSMEs in the Western Cape province.
- Whether the assumption of a linear relationship between the independent variable and the dependent variable has been met or violated.
- Whether the assumption of normality of the independent variable and the dependent variable has been met or violated.
- The absence or presence of outliers in the data set.
- The direction of the relationship between the independent variable and the dependent variable.
- The significance of the relationship between the independent variable and the dependent variable.
- (I), (II), and (VI)
- (II), (III), and (V)
- (III), (IV), and (V)
- (II), (IV) and (V)
QUESTION 18
Compute the correlation coefficient for the data in Table D.
- A. 0.8561
- 0.4914
- 0.9253
- 0.9836
QUESTION 19
Determine the linear regression equation of the relationship between the independent variable (x) and the dependent variable (y).
- y = 0.4914 + 0.1248x
- A. y = 0.4914x + 0.1248
- y = 0.4914x – 0.1248
- D. y = – 0.4914 + 0.1248x
QUESTION 20
For a small enterprise with an average annual sales amounting to R50 million during the 2020 – 2022 period, estimate the average annual earnings for the period.
- Approximately 2 million
- Approximately 9 million
- Approximately 7 million
- Approximately 5 million
QUESTION 21
Which of the following observations about the slope of the least squares regression line of the Sales-Earnings model is correct?
- During the 2020 – 2022 period, every Rand increase in sales on average led to approximately 12 cents increase in earnings.
- During the 2020 – 2022 period, every Rand increase in sales on average led to approximately 49 cents increase in earnings.
- During the 2020 – 2022 period, every Rand increase in sales on average led to approximately 49 cents decrease in earnings.
- During the 2020 – 2022 period, every Rand increase in sales on average led to approximately 12 cents decrease in earnings.
SECTION E
Study the information provided below and answer questions 22 to 25.
The data in Table E, below, represents the annual sales of MFG Inc. over the 2010 – 2021 fiscal period.
Table E: Annual Sales of MFG Inc. during the 2010 – 2021 period
| Year | Sales, (R millions) |
| 2010 | 6 |
| 2011 | 9 |
| 2012 | 12 |
| 2013 | 15 |
| 2014 | 20 |
| 2015 | 15 |
| 2016 | 13 |
| 2017 | 8 |
| 2018 | 12 |
| 2019 | 16 |
| 2020 | 18 |
| 2021 | 21 |
QUESTION 22
With reference to time series data, whch of the following components is often subdivided into episodic and residual variations?
- Secular trend
- Cyclical variation
- Seasonal variation
- Irregular variation
QUESTION 23
To determine the ideal smoothing constant to be used for a simple exponential smoothing forecasting, a data analyst randomly selected three exponential constants (0,2, 0,5, and 0,8) and produced the forecasts shown in the table of analysis below.
| Forecast 1
(a = 0,2) |
Forecast 2
(a = 0,5) |
Forecast 3
(a = 0,8) |
||
| Year | Sales, (R millions) | Sales, (R millions) | Sales, (R millions) | Sales, (R millions) |
| 2010 | 6 | – | – | – |
| 2011 | 9 | – | – | – |
| 2012 | 12 | 6,6 | 7,5 | 8,4 |
| 2013 | 15 | 7,68 | 9,75 | 11,28 |
| 2014 | 20 | 9,14 | 12,38 | 14,26 |
| 2015 | 15 | M | 16,19 | 18,85 |
| 2016 | 13 | 12,05 | 15,59 | 15,77 |
| 2017 | 8 | N | 14,3 | 13,55 |
| 2018 | 12 | 11,39 | P | 9,11 |
| 2019 | 16 | 11,51 | 11,57 | R |
| 2020 | 18 | 12,41 | Q | 15,08 |
| 2021 | 21 | 13,53 | 15,89 | S |
Determine the values represented by M, P and R in the table of analysis above?
- M = 39 million, P = R13.05 million, and R = 13.42 million
- M = 32 million, P = R11.15 million, and R = 11.42 million
- M = 32 million, P = R13.05 million, and R = 13.42 million
- M = 39 million, P = R11.15 million, and R = 11,42 million
QUESTION 24
Determine the values represented by N, Q and S in the table of analysis in question 23?
- N = 52 million, Q = R15.08 million, and S = 1f8.12 million
- N = 24 million, Q = R13.79 million, and S = 17.42 million
- N = 38 million, Q = R13.85 million, and S = 18.17 million
- N = 51 million, Q = R14.15 million, and S = 17.83 million
QUESTION 25
Using the forecasts for the 2012 – 2021 period, determine the mean absolute deviation (MAD) of Forecast 1, Forecast 2 and Forecast 3.
- The MAD of Forecast 1, Forecast 2, and Forecast 3 are 32, 4.16 and 3.76 respectively.
- The MAD of Forecast 1, Forecast 2, and Forecast 3 are 32, 4.21 and 4.06 respectively.
- The MAD of Forecast 1, Forecast 2, and Forecast 3 are 06, 4.21 and 3.76 respectively.
- The MAD of Forecast 1, Forecast 2, and Forecast 3 are 06, 4.20 and 3.92 respectively.
