

- Case StudyHelp.com
- Sample Questions
Are You Looking for Financial Statement Analysis Sample Assignment Answers Solution? Gets Financial Accounting Assignment Sample, Finance Case Study Assignment Solution & MBA Finance Assignment Help from PhD/MBA Experts at cost-effective rates? Acquire HD Quality research work with 100% Plagiarism free content

Critical Review of Traditional and Contemporary Methods on Financial Analysis
1.0 Introduction
This report is conducted in concern to critically review the traditional and contemporary methods involved in assessing a company’s operational efficiency, financial position and performance. Financial Analysis is the process in deciding the significance of the items in financial statement, which measures the company’s profitability, forecast of the future earnings, solvency and other indicators to assess its operating efficiency, financial position and performance (Ravinder D.D & Anitha M., 2013). Although there are many different techniques that been used in the analysis of financial statements, this report wills critically analyze the horizontal analysis, vertical analysis and ratio analysis from the traditional method with practical illustrations of two companies namely Wolseley and Rexam in comparing the financial and operating performance. Meanwhile, CAPM, DGM and EMH analysis from the contemporary method will be discussed to gauge the extent of this methods in overcoming the limitations of traditional analysis techniques. Lastly, a comprehensive conclusion will be drawn high lighting the best available option in the shelf.
Critical Review of Traditional Methods of Financial Analysis
Horizontal Analysis / Trend Analysis
Horizontal analysis or known as trend analysis is a financial statement analysis technique that shows changes in the amounts of corresponding financial statement items over a period of time. Sharma R. (2012) favors this analysis as it is an easy association of info that is arranged by historical in which each succeeding period express in percentage of the amount of the initial year. It is a convenient tool to assess the trend situations which can determine on how a company has grown over the time (Singh U., 2010). It also can provide the comparison between two or more companies over a period of time and compared with industry average (Nissim D., 2010). With this information, it aids analyst to appreciate the strength or weakness of a particular company in evaluation with other related competitors in trade. Besides, Dufera A. (2010) favors horizontal analysis as it is valuable for comparative analysis in measuring the financial performances of a company over a historical stretch in which assists the organization to make decisions for the future.
Referring to the Table 1.1 in appendix, Wolseley experience continues decline in the revenue from the year 2013 until year 2014. A declining tread of 1.99% in 2013, 8.57% in 2014 and 0.66% in year 2015 was been noticed. Wolseley has regained its performance in the last year of study with its growth of 7.52%. Meanwhile, analysis on Wolseley’s total assets indicates that it is at declining trend from year 2013 till year 2014. The percentage decline stands at 1.37% in 2013, and 5.49% in 2014 respectively. However, Wolseley’s start regaining its total asset from year 2015 where it increased to 4.79% and further up to 14.16% in 2016. Therefore, it is supported that horizontal analysis is a significant tool for financial experts to use horizontal analysis in measuring the financial performances of a company over a period of time as per stated by Dufera (2016) in his study.
Although horizontal analysis provides simple method in evaluating financial statement across the financial years and multiple companies, it comes with certain limitation. Scott & Storper (2014) criticize the method for not factoring the inflationary situation as it leads to inputs of misleading information by severely depending on historical cost. Meanwhile, (Dufera, 2010) criticize this method as it has the loopholes in the selection of the base year as companies can manipulate the base year which the results will jive with the intended reporting.
As per appendix table 1.2 on Tate & Lye, revenue has declined over the years till 2015. The declining trend seems to be bad where it is from 5.44% in 2015 and drop to -10.82% in 2014 and further drastically drop to -24.19% in 2015. It regained a little in year 2016 to -23.74% although it is still at the loss. It is proven that by using trend analysis although the trend of the company’s performance can be quickly observed but the factors such as inflation or other market related factors as stated by Scott & Storper (2014) is not in any part of the analysis. Hence, it stands as the shortcoming of this model.
Vertical Analysis / Common-Size Analysis
Vertical analysis as well-known as common-size analysis is a technique of assessing financial data by uttering each point in a financial statement as a percentage of a base amount for the equal time period. Sharma R. (2012) favors vertical analysis as it benefits the experts to determine the structural relations at a glance on the numerous components of cost, expenses, assets, liabilities and etc. Besides, as method is easy to understand and the items percentages can be easily pointed out, companies management prefers this method of analysis in reviewing the financial statements (James, 1968). Meanwhile, (Nissim, 2010) favors it as allows the company’s financial statement to be signified within a fixed method across all industries which
permits for an easy assessment be it yearly quarter, progressive quarter or analysis of extended time periods.
Referring to Table 2.2 in appendix, Wolseley total non-current asset performance over its total assets seems to be at a mix trend as it has an up’s and down’s throughout the year of studies. Total non-current asset performance seems to have increased in year 2013 and 2014 compared to year 2012 where the percentage stand at 38.7% in 2012; 40.7% in 2013 and 42.2% in 2014. Although total non-current asset performance was at increasing trend, in year 2015 it had a sudden dip of 8% compared previous and stand at 34.2%. However, in 2016 it has regained additional 1.4% and stands at 35.8%. From the above analysis, as James (1968) mentioned in his studies, it is proven that vertical analysis can be easily understood and the items percentages can be easily pointed out.
The drawback of the vertical analysis mentioned by Sharma R. (2010) is that the liquid and solvency position of a company cannot be measured as it do not support to establish the ratios be it liquid ratio, debt equity capital ratio, current ratio, capital gearing ratio and etc. which is useful in testing the liquidity and solvency of a company. On top of it, Sharma R. (2010) also said that vertical analysis could not help in making decisions due to unavailability of the standard ratio/percentage concerning the variation of various component of assets, liabilities, sales and etc. Besides, (Singh U., 2010) mentioned that companies with different accounting policies can artificially inflate or deflate accounts, making common-size analysis less useful.
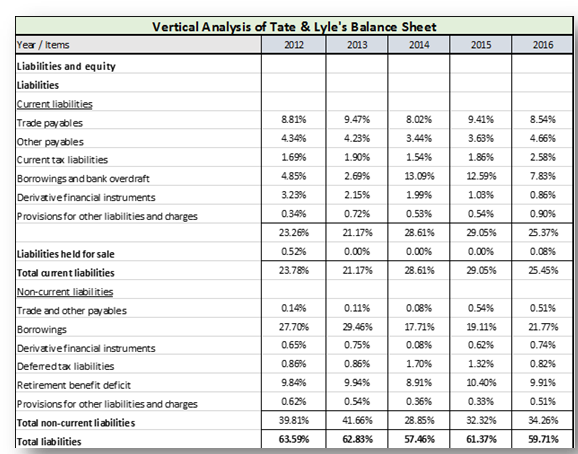
As per appendix table 2.4, Tate & Lyle total current asset seems to be very volatile. In the year of 2012 it was at 44.36% and increase to 48.87% in year 2013 which seems to be a good indication. However, in year 2014 till 2016 total current asset of Tate & Lyle has dropped tremendously which is at 43.03% in 2014, dropped further to 38.38% in 2015. Somehow rather, Tate & Lyle managed to regain its total current asset in year 2016 which is up by 3.01% to 41.39%. From this analysis it is noticeable that as Sharma, R. (2010) mention that the liquid and solvency position of a company cannot be measured using vertical analysis. On top of it, this analysis unable to help in making decision as the percentage changes of components are unavailable.
Traditional Ratio Analysis
The financial ratio analysis is a quantitative analysis of reviewing the info contained in firm’s financial statements with numerous ratios which shows relation between diverse items from the balance sheet, statement of operations and statement of cash flows. (Altman E.I., 1968).
Stepanyan A., (2014) favors ratio analysis could provide quick and valuable information without going through the entire financial statement, this is the most preferred analysis statement for evaluating companies’ performance be it for investing or financing purposes. Meanwhile, Dalabeeh A.R., (2013) prefers it as the efficiency, liquidity, profitability and solvency ratios helps in judging the companies operation and management efficiencies.
Analyzing the tables below that indicates how relative is Wolseley and Tate & Lyle to its total assets. ROA gives an idea as to how efficient a company’s management is at using its assets to generate earnings. Observing the trend in Table 2.3.1, Wolseley shows a good trend till year 2014 where it leaped from 0.8% to 4.2% in 2013 and another upturn to 7.5% in 2014. However in year 2015, Wolseley’s ROA was valuated at 2.8% which seems to be a huge drop from previous year. As of year it managed to regain its ROA growth to 8%. Meanwhile, looking at Tate & Lyle’s ROA performance, we can conclude that it has a very volatile trend throughout the years of studies which is from year 2012 up to year 2016. In year 2012 the ROA for Tate & Lyle stands at 10.6% then drop to 9.8% in year 2013 and increase to the highest compared to all 5 year to 11.1% in 2014. Although Tate & Lyle’s ROA stands at good percentage in year 2014, in 2015 seems to be the worst ROA of all 5 years with 1.2%. However, it uplifted its ROA in 2016 6.4%. As mentioned by Stepanyan A., (2014), ratio analysis could provide valuable information quickly without going through the entire financial statement.
| Year | 2012 | 2013 | 2014 | 2015 | 2016 |
| Wolseley’s Return on Asset (ROA) | 0.8% | 4.2% | 7.5% | 2.8% | 8.0% |
| Tate & Lyle’s Return on Asset (ROA) | 10.6% | 9.8% | 11.1% | 1.2% | 6.4% |
Table 2.3.1 Wolseley’s and Tate & Lyle’s Return on Asset (ROA)
Despite usefulness, financial ratio analysis has some limitations. Different companies operate in different industries has differences in regulation, market structure, etc. where this different factors are so significant that a comparison of two companies from different industries using ratio analysis might lead to misleading conclusions (Altman E.I., 1968). Delen, Kuzey and Uyar (2013) said the ratio analysis has limitations on the point in time as some ratios extract information from the income statement is stated in current costs whereas some elements of the balance sheet may be stated in historical cost. This disparity can result in unusual ratio results. To add on further, Ali, A. and Haque, M. I. (2014) said it can be quite difficult to ascertain the reason for the results of ratio analysis as it may look good at a glance but when
further analyzed it could be due to a short term transaction done by the business and the ratios will probably decline in the near future.
Table 2.3.2 illustrates Wolseley and Tate & Lyle’ ROE which is a true bottom-line profitability metric, comparing the profit available to shareholders to the capital provided or owned by shareholders. Looking at the percentage figure, of both companies, seems to experience a mixed trend with some major variances in between some years. For example, Wolseley’s ROE ending figure in year 2016 indicates a major incline stating at 22.4% despite steep ups and downs from year 2012. As such, this hyped figures became questionable whether the incline is due to short term transaction or vice versa. On top of it, Tate & Lyle ROE appears to experience same tread as Wolseley’s ROE where it hike up to 11.1% in year 2014 and tailed with a very sharp drop to 1.2% in year 2015. The above ROE analysis supports the findings from Ali, A. and Haque, M. I. (2014) where it said that it can be quite difficult to ascertain the reason for the results of ratio analysis as it may look good at a glance but when further analyzed it could be due to a short term transaction done by the business and the ratios will probably decline in the near future which might lead investors to make wrong decisions.
| Year | 2012 | 2013 | 2014 | 2015 | 2016 |
| Wolseley’s Return on Equity (ROE) | 1.8% | 9.7% | 17.5% | 8.2% | 22.4% |
| Tate & Lyle’s Return on Equity (ROE) | 10.6% | 9.8% | 11.1% | 1.2% | 6.4% |
Table 2.3.2 Wolseley’s and Tate & Lyle’s Return on Equity (ROE)
Contemporary Methods of Financial Analysis
Capital Asset Pricing Model (CAPM)
Capital Asset Pricing Model (CAPM) is a widely used model that defines the connection among risk and anticipated return, and helps as a model for the assessing of uncertain securities. The model is established on the association among asset’s beta, the risk-free rate and the equity risk premium (Sharpe W.F., 1964) and (Lintner J., 1964). Fama
E.F. and French K.R. (2004) favors this model as it offers basic calculation that can be certainly stress-tested to develop a series of probable conclusions to offer assurance around the essential rates of return. Meanwhile, Black F., Jensens M.C and Scholes M. (1972) prefers this model as it considers the organized risk, imitating a truth in which most stakeholders have expanded portfolios and produces a theoretically-derived correlation among essential profit and systematic risk which has been matter to common empirical research and testing. As such, the
contemporary method (CAPM) seems to overcome the traditional methods (horizontal analysis, vertical analysis and ratio analysis) shortcomings by including the systematic risks when comparing company’s performance which was ideally disregarded by the traditional methods (Fama E.F. and French K.R.,2004)
Like many systematic models, the CAPM has its disadvantages. Banz R. (1981) says CAPM doesn’t seems to describe small stocks expected returns and the event samples are based on small stocks, the results will be misleading. Meanwhile, according to Ariel R.A. (1987) as CAPM is built based on number of assumptions which is unrealistic such as stakeholders can borrow and loan at a risk-free rate in which leads this model to calculate inaccurate rate of returns than the actual situation. On top of it, Black F., Jensens M.C and Scholes M. (1972) says as CAPM uses beta as the measure of a securities future risk and it is estimated based on historical data, CAPM seems to be a poor indicator of the future risk of securities.
Overall CAPM’ overcomes the limitation of traditional Financial Analysis model such as Vertical, Horizontal and Ratio Analysis by adding systematic risk in the equation to derive the “cost of equity” which was not factored in early methods, this is important factor as the investors cannot control the risk or mitigate the risk Fama and Kenneth (2004). CAPM provides a more meaningful and useful outcome compared to traditional method as it easy to calculate and have been stress tested over the time compared to previous models or methods as describe in Leshem R. et.al (2016) research. CAPM also overcomes the traditional models by the assumption that investors hold diversified portfolios thus removes the unsystematic risk on the investment.
CAPM is a very beneficial method for appreciative the risk return relations in malice of its limits. It disables the limitations of the traditional methods (horizontal analysis, vertical analysis and ratio analysis) by taking systematic risk into count for the equation to derive the “cost of equity”. Investors look up to this factor as they cannot control or mitigate the risk either (Fama E.F. or French K.R., 2004). As Leshem R. et.al (2016) said, comparing to traditional method, CAPM provides a more meaningful results with an easier method of calculation and stress-tested.
Dividend Growth Model (DGM)
Dividend growth model is a fundamental analysis method in calculating the essential worth of stock, during a special current market condition (Foerster and Sapp, 2005). The model compares this value to the current value of a stock’s forthcoming dividends. The dividend growth model also decides if a stock is overrated or underrated assuming that the
company’s projected dividends grow at a value which than deducted from the required rate of return (Gordon and Shapiro, 1962). Michaud and Davis (1982) favors this model as it is easy to understand as well as to use it. Meanwhile, Payne and Finch (1999) likes this model as for the consistencies of the dividends where it tends to stay consistent for a longer period of time comparing to items in the cash flow. Olweny (2011) favors this model as it covers wider scope by taking dividend as it is the only metric that can be used to value a company with minority shareholders.
The dividend discount model also has its limitation. Payne and Finch (1999) criticize this model as it is only valid to a firm and mature companies and has a track record of remunerating out dividends constantly as such it this model has limited use. Another major disadvantage of DGM is this model may not be related to earnings as it makes assumptions that the dividends paid are linked to incomes which means a higher incomes will convert into a higher dividends and vice versa (Damodaran, 2006).
Hence, with couple of limitations listed for DGM model, this model is far effective than traditional analysis models and overcomes their limitation such as ratio analysis by enabling to compare companies from different industries as well as market conditions (Foerster and Sapp, 2004).
Effective Market Hypothesis (EMH)
Fama, E.F. (1965) said EMH is a market theory that indicates in a liquid market, security prices will fully reflect all the available information at any point of time. The EMH occurs in several degrees namely weak, semi-strong and strong, where it addresses the attachment of non-public information in market prices.

Despite usefulness, EMH has its inefficiency. Grossman, R. et al. (1980) told, markets could not be efficient as there is availability of cost of information. As such, the return on investment must be much higher than the cost of information. If it is otherwise, the tendency to invest will not exist. Meanwhile, De Bondt and Thaler (1985) opposed the EMH as the actual instability of stock prices had been higher than that calculated on the basis of essential data, people seems to exaggerate to company statements, which it will resulted on the stock prices.
Despite all the criticism received by EMH has reduce its popularity, EMH model overcomes the limitation of traditional method in which it provides investors to get an idea of market efficiency. This information is unavailable in traditional method in which it enable the investors in making decision on which portfolios to invest on. (Shiller, R., 2003)
4.0 Conclusion
In conclusion, by reviewing the comparative financial statements using traditional method (Horizontal Analysis, Vertical Analysis and Ratio Analysis) and contemporary method of financial analysis (CAPM, DGM and EMH), it is evident that both methods has its fair strength and weaknesses and presents different analysis and findings for users. In short, although traditional method is easy to understand and gives an idea of overall company’s performance at a glance, its limitations on market data, inflation or sessional effects make it practically inadequate to be engaged (Scott & Storper, 2014). Meanwhile, contemporary methods as
CAPM is widely used today as it pro
5.0 Appendixes
1.0 Horizontal Analysis
TABLE 1.1: Wolseley’s Income Statement
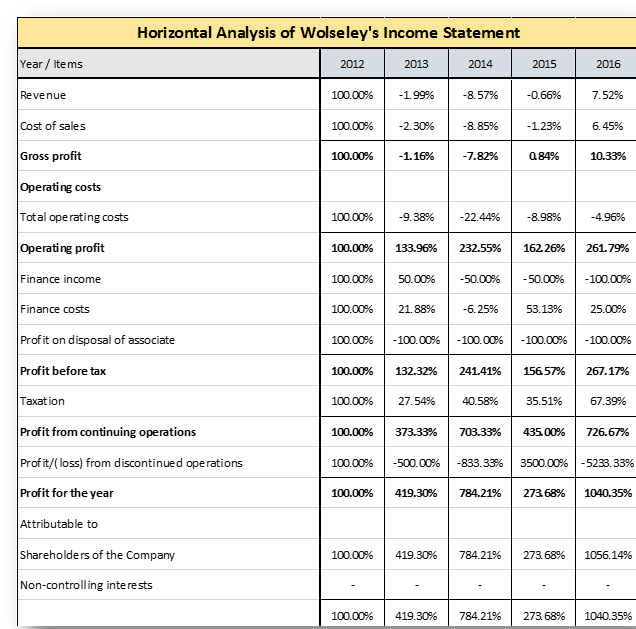
TABLE 1.2: Wolseley’s Balance Sheet
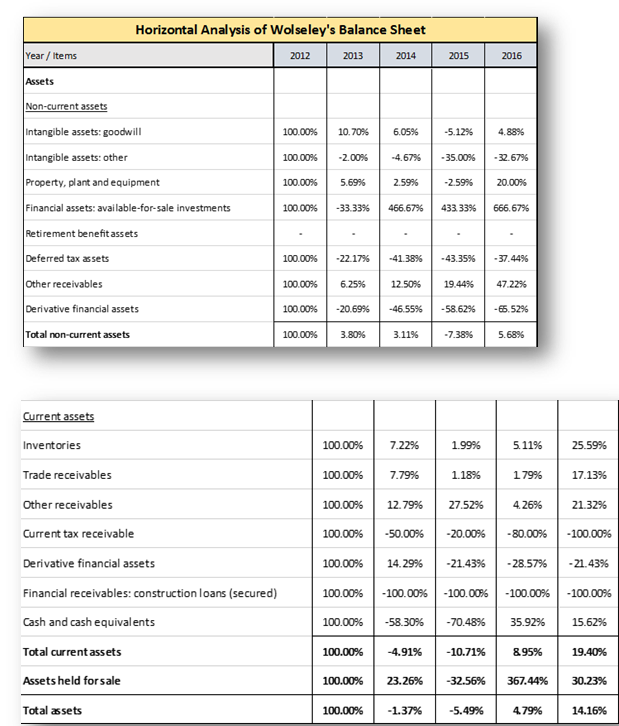
TABLE 1.2: Wolseley’s Balance Sheet (con’t)
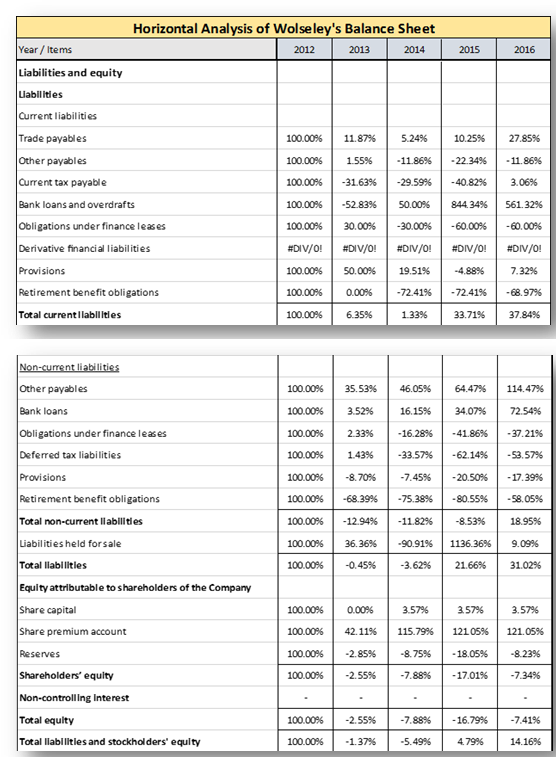
TABLE 1.3: Tate & Lyle’s Income Statement
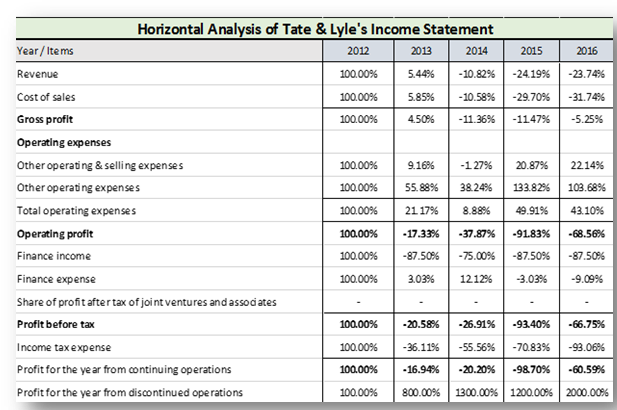
TABLE 1.4: Tate & Lyle’s Balance Sheet
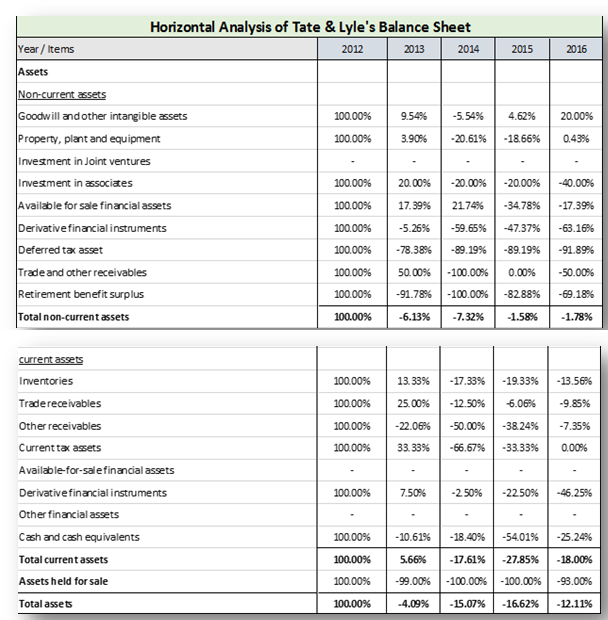
TABLE 1.4: Tate & Lyle’s Balance Sheet (con’t)

2.0 Vertical Analysis
TABLE 2.1: Wolseley’s Income Statement

TABLE 2.2: Wolseley’s Balance Sheet
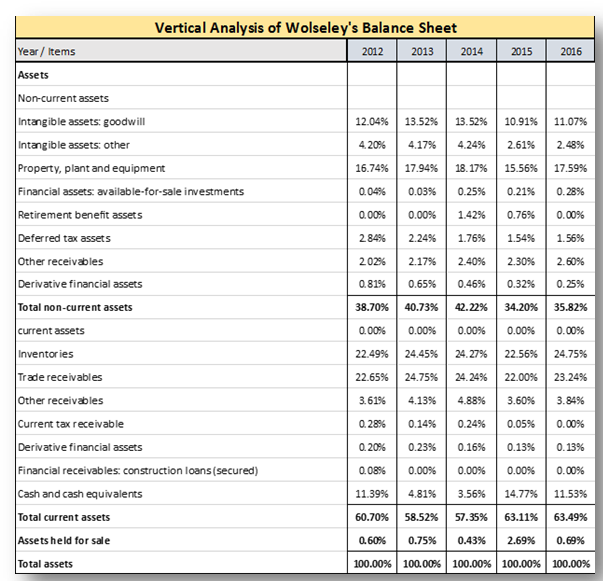
TABLE 2.2: Wolseley’s Balance Sheet (con’t)
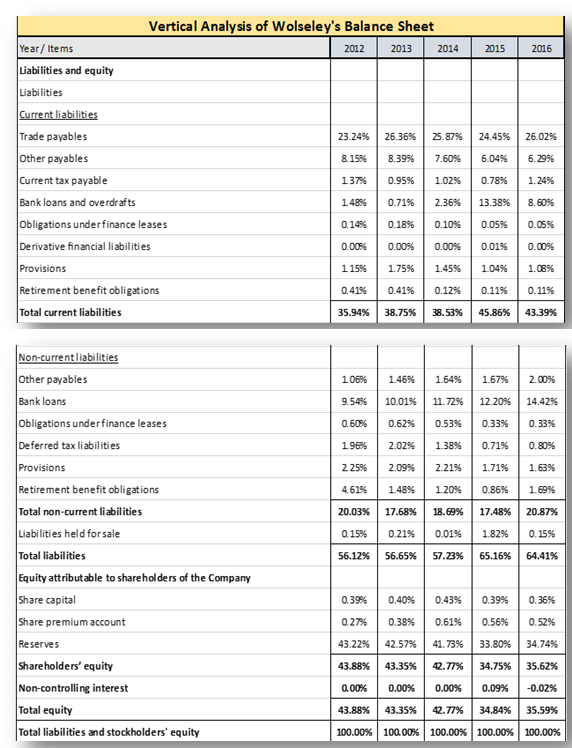
TABLE 2.3: Tate & Lyle’s Income Statement
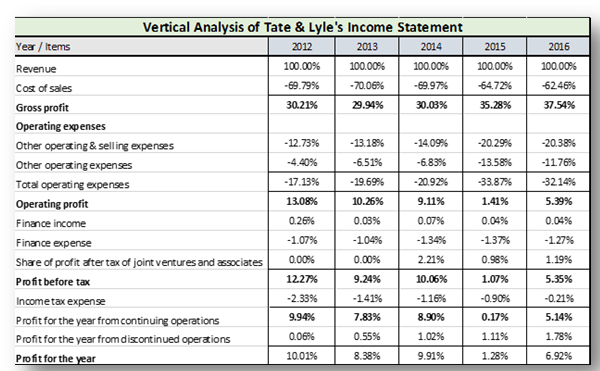
TABLE 2.4: Tate & Lyle’s Balance Sheet

TABLE 2.4: Tate & Lyle’s Balance Sheet (con’t)
6.0 References

More Information:
Financial Assignment Sample 2 PDF

Financial Assignment Sample 3 PDF
Reference ID: #getanswers19120004
