

- Case StudyHelp.com
- Sample Questions
Get Assignment Answers on Selection of Balancing Method for Manual Assembly Line of Two Stages Gearbox
Pages/Words : 1 Page/250 Words
Looking for Selection of Balancing Method for Manual Assembly Line of Two Stages Gearbox- Assignment Answers? We provide online assignment help related to case studies for any academic subject. The 3000+ PhD level expert writers working tirelessly behind our brand provide top quality academic assignment help, even if it’s regarding a case study. Apart from addressing case studies, our highly qualified writers emphasize assignment help services like essay help, homework help and assignment help services. Students from numerous countries like Australia, Singapore, the UAE and the UK avail of our case study help.

Why do you think managing a high-volume continuous operation is easier than managing a high-variety intermittent operation?
Abstract–A study imitating a procedure of a Two Stages Gear Box (2SGB) assembly line layout is presented. Three balancing methods are studied in which 2SGB is assembled. These methods are Rank position weight, larger candidate rate, and Column method. The selection criterion was based on minimum assembly time for all method. Three assembly line processing layouts were developed based on output of assembly methods which are the single straight line, circle and mixed (circle + straight) processing. The best layout was found to be the line stations layout by Ranked Positional Weight Method with 4 stations and total assembly time of 4.25 minutes per gearbox. Each station has one worker, the service time of 1.1 minutes, line balancing efficiency was 0.964, and labor efficiency was 0.8884.
Keywords-Manual Assembly Line; Assembly Balancing Methods; Gearbox Assembly Line
1. INTRODUCTION
Process planning is mainly relevant to generating line balancing set of steps required to approach specified aims, with given constraints, as an attempt to enhance a part of the criteria [1]. Balancing assembly lines becomes one of the most important parts for an industrial manufacturing system that should be supervised carefully. The success of achieving the goal of production is influenced significantly by balancing assembly lines. Since then, many industries and for sure researchers, attempt to find the best methods or techniques to keep the assembly line balanced and then, to make it more efficient. Furthermore, this problem is known as an assembly lines balancing problem [2].
An assembly line consists of workstations that produce a product as it moves successively from one workstation to the next along the line, which this line could be straight, u-line or parallel until completed. To balance an assembly line, some methods have been originally introduced to increase productivity and efficiency. These objectives are achieved by reducing the amount of required manufacturing time to produce a finished product, by reduction in number of workstations or both of them [3].
This study involved applying the three heuristic algorithms to study the two-stage gear box process planning gaining a reduced production time. In this paper, three assembly balancing methods were studied: largest Candidate Rule (LCR), Kilbridge and Wester (KWC), and Ranked Positional Weight (RPW) to select best one for Manual Assembly Line of Two Stages Gearbox.
C. Largest Candidate Rule (LCR) Method
Known as the main aim of the Line Balance is to distribute the total workload on the assembly line as evenly as possible, despite the reality in which it is impossible to obtain a perfect line balance among the workers. It is then the role of line balance efficiency which is related to the differences in minimum rational work element time and the precedence constraints between the elements. The Largest Candidate Rule (LCR) accounts for work elements to be arranged in a descending order (with reference to the station time Ts, and work elements) to each station Tek value which is not exceeding the allowable preceded Ts [4].
B. Kilbridge and Wester Column(KWC) Method
Kilbridge and Wester (column) method is a heuristic procedure that selects work elements for assignment to stations according to their positions in the precedence diagram. This methods known for its reliability in overcoming the difficulties such as encountered in Largest Candidates Rule method where an element could be selected with respect to high Te value but irrespective of its position in the precedence diagram [4]. However in the column method the elements are arranged into columns.
C. Ranked Positional Weight (RPW) Method
Ranked positional Weight Method (RPW) was introduced by Helgeson and Birnie in 1961 [5], which it’s a value to be computed for each element in the system. The RPWek accounts for each Tek and its position on the raw chain in the precedent diagram. Tek is a time to perform work element k, minute and hence these values of Tek are additives.
2. LITERATURE REVIEW
Balancing assembly lines is a very important mission for manufacturing industries in order to improve productivity by minimizing the cycle time or the number of workstations. The balancing problems manage the assignment of tasks to workstations to achieve the purpose objectives. The general practice in the assembly line balancing is to assign tasks to workstations in such a way that each total time of assigned tasks to each workstation has an equal line cycle time [6].
Assembly Line Balancing (ALB) is defined as to be a number of workstations placed along of a conveyor or table which used to transfer the products between the stations. Input raw materials or semi-finished product enter the operation line through the workstations to the output store. Cycle time is determined for each workstation depends on the target product demand. It’s computed as the hourly available time of work per demand during that particular period. The two goals for the Simple Assembly Line Balancing (SALB) are to minimize both the cycle time and workstation numbers in order to reach at the target demand [7].
Pinto and Khumawala [8] proposed an integer programming formulation to decide which processing alternative from the existing station to use in order to shorten the task duration for a given total cost. Due to, the type of process is a manual assembly and each task can be performed at any station, this proposal has been created to achieve the target objectives of minimizing the cycle time or the cost or either minimize or maximize the work stations. Malakooti and Kumar [9] used a multicriteria decision-aid method for Assembly Line Balance (ALB) problems where emphasized on the number of stations, the cycle time, the buffer size and the total cost of the operations. For the Simple Assembly Line Balance Problem (SALB), Minzu and Henrioud [1] proposed a ‘kangaroo’ algorithm (a stochastic descent method) to treat the problem of assembly line with a fixed number of stations. The stochastic descent method aims to minimize the maximum work content of the stations, which leads to a well balanced line.
Carnahan et al. [10] proposed a methodology for the Assembly Line Balance (ALB) considering both production objectives cycle time and number of station as well as worker physical constraints. Bukchin and Tzur [11] developed a heuristic algorithm to design flexible assembly line when several equipment alternatives are available. The objective was to minimize the equipment cost by controlling parameters determines how many nodes could be skipped in the tree and reducing the size of precedence graph.
The Largest Candidate, Kilbridge and Wester (column) and Ranked Positional Weights (RPW) are different heuristic methods commonly utilized to arrange and distribute the description element time along the workstations in the system. Each of those methods could be results in a different type of workstations layout [4].
Mat, Muhamad, and Law [12] from University Technology Malaysia in their thesis are used three manual line balancing method (Largest Candidate Rule, Kilbridge and Wester Method and Ranked Positional Weight) and four generated alternatives had been used to balance assembly line of car manufacturing company to improve the efficiency of its situation. Results revealed that productivity increases about three times higher than the assembly line efficiency before the study. Kamlekar1, Gupta, and Dalpati [13] developed an improved layout for a manufacturing company with the objective of productivity improvement.
The methodology adopted for the study includes identification of problems associated with the existing that is layout redesigned for each workstation. The need to identify workstations by their position along the line is illustrated by the typical need of line managers to define unmovable operations and zoning constraints. This improved assembly line is further verified by time study techniques. The goal is to obtain an optimum layout in terms of line efficiency and productivity rate.
Mahto, and Kumar [14] used two commonly procedures namely the Kilbridge-Wester Heuristic approach and the Helgeson-Birnie Approach to design an assembly line starting from the work breakdown structure to the final grouping of tasks at work stations. The specific objectives of the paper was to optimize crew size, system utilization, the probability of jobs being completed within a certain time frame and system design costs. These objectives were addressed simultaneously, and the results obtained were compared with those of single-objective approaches.
3. ASSEMBLY LINE BALANCING
Assembly is a manufacturing process in which interchangeable parts are added in a sequential manner using certain material flow and design layouts. The line assembly is the efficient utilization of facilities with minimum material handling as well as easy production control. Since different workstations have different working capacity it is then important to apportionment the sequential work activities in to workstations in order to achieve a high utilization of labor, equipments, and time.
The important parameters in Line Balancing are [15]:
Line Efficiency (LE) = (Total Station Line Time ÷ Cycle time x no. of workstations) x 100% (1)
Balance Delay (BD) = (Total idle time ÷ total available working time on all stations) x 100% (2)
A. Analysis of a Single Model Assembly Line
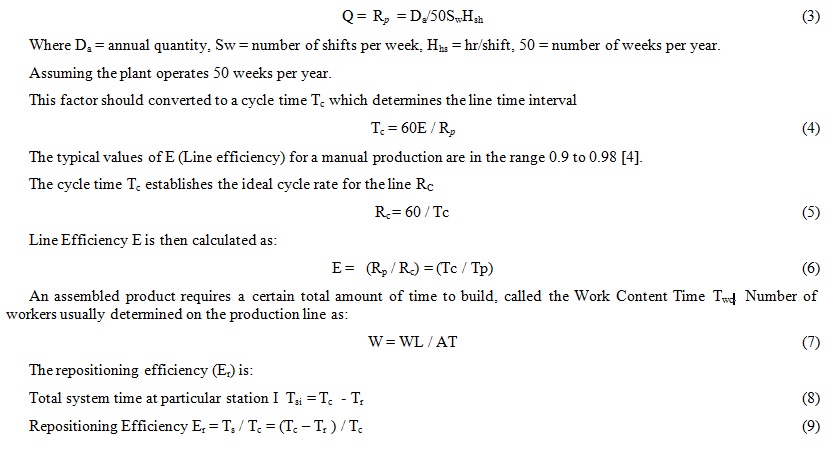
The assembly line design should account for the Production Rate Rp that is sufficient to reach the desired demand (Quantity) for the product. The product volume is often determined as an annual quantity as follow [4]:
4. DATA COLLECTION
Vatkar is developed epicyclical spur two-stage gearbox for sintering manufacturing process. Sintering type of manufacturing process was developed for a long time and its usage has been limited by knowledge of material and designs are integrated for optimization. The advantage of using this sintered materials and design to save cost and provide a reliable product [16].
The selected unit to assemble is shown in Fig.1, which present the components of the selected product including the names and the identification for each part [16].
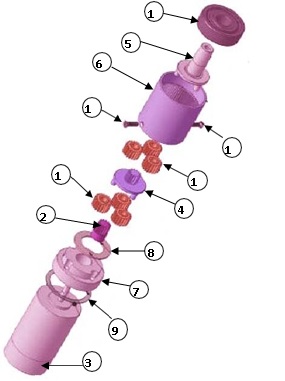
Fig. 1 A two stages metal gearbox assembly components
| PARTS LIST | ||
| ELEMENT | QTY | DESCRIPTION |
| 1 | 6 | 20 TEETH PLANET |
| 2 | 1 | 14 TEETH PINION |
| 3 | 1 | BRUSHLESS DC MOTOR |
| 4 | 1 | 14 TEETH CARRIER SPIDER GEAR |
| 5 | 1 | 3 PIN OUTPUT CARRIER SHAFT |
| 6 | 1 | 70 TEETH RING GEAR |
| 7 | 1 | ALUMINUM SLEEVE |
| 8 | 1 | DELRIN WASHER |
| 9 | 1 | GASKET |
| 10 | 2 | MACHINE SCREW |
| 11 | 1 | 6200-2 RSH BALL BEARING |
Data presented in the Table (1) represents the concept defined by with experts where the times were provided by (Automatic Spare Parts Company) based on the mean value of three sequenced measures using a stopwatch for the regard elements. These Tek values are shown in Table 1 and the preceding diagram of activities are shown in Figure 2.
TABLE I WORK ELEMENTS ASSIGNED TO THE STATIONS
elements Work Element Description Tek seconds Tek Station Time (minutes) Preceded By
| 1 | Load 6 | 2 | 0.0333 | – |
| 2 | Grease inside 6 | 45 | 0.75 | 1 |
| 3 | 11 in 6 | 10 | 0.167 | 2 |
| 4 | 5 inside 11 and Grease | 8 | 0.1333 | 3 |
| 5 | 1a inside 5 and Grease | 27 | 0.45 | 4 |
| 6 | 4 inside 1a and Grease | 7 | 0.1167 | 5 |
| 7 | 1b inside 4 and Grease | 25 | 0.4167 | 6 |
| 8 | 2 inside 1b and Grease | 7 | 0.1167 | 7 |
| 9 | 3 inside 3 and Grease | 5 | 0.0833 | – |
| 10 | 7 over 3 and screwed | 41 | 0.6833 | 3 |
| 11 | 8 over 7 | 5 | 0..0833 | 10 |
| 12 | 1 – 8 with 3 – 11 | 10 | 0.167 | 8,11 |
| 13 | Screwing and adjusting | 50 | 0.833 | 12 |
| 14 | Cleaning the Grease | 10 | 0.167 | 13 |
| 15 | Unload | 3 | 0.05 | 14 |
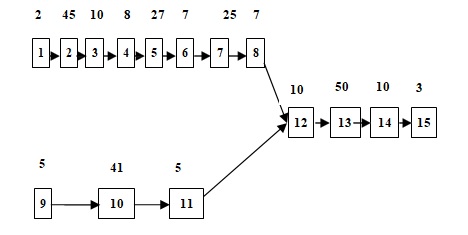
Fig. 2 the proposed precedence diagram
5. RESULTS AND DATA ANALYSIS
A. Largest Candidate Rule Algorithm (LCR)
In this approach work elements were arranged in descending order according to their Tek values as presented in Tables (2 and 3). Worker was assigned by elements at the first workstation by starting at the top of the list and selected the first element that satisfies precedence requirements and does not causing the total sum of Tek at that station to exceed the allowable Ts when an element is selected for assignment to the station, started backward at the top of the list for the subsequent assignments.
The procedure then followed by stating that no more elements could be assigned without exceeding Ts and proceeded to the next station. Consequently, repeating the previous steps for as many additional stations as possible until all elements have been assigned as shown in the precedence diagram, Figure 3 and work station layout, Figure 4, and each station work elements were shown in Table 4.The idle time was determined to be 1 second for Station 1, 3 seconds for Station 2, zero second for Station 3 and 5 seconds for Station 4, Figure 5. In this case, Station 3 is the bottleneck station which has the maximum working time during one production cycle.
TABLE II WORK ELEMENTS ASSIGNED AS STATIONS ACCORDING TO THE LCR
Element Tek sec. preceding By
| 13 | 50 | 12 |
| 2 | 45 | 1 |
| 10 | 41 | 3 |
| 5 | 27 | 4 |
| 7 | 25 | 6 |
| 3 | 10 | 2 |
| 12 | 10 | 8,11 |
| 14 | 10 | 13 |
| 4 | 8 | 3 |
| 6 | 7 | 5 |
| 8 | 7 | 7 |
| 3 | 5 | – |
| 11 | 5 | 10 |
| 15 | 3 | 14 |
| 1 | 2 | – |
TABLE III WORK ELEMENTS ARRANGED ACCORDING TO TEK VALUES FOR THE LCR
element Tek sec. preceding By Sta. No. sta. T sec
| 13 | 50 | 12 | 1 | 65 |
| 14 | 10 | 13 | ||
| 15 | 3 | 14 | ||
| 1 | 2 | – | ||
| 2 | 45 | 1 | 2 | 63 |
| 3 | 10 | 2 | ||
| 4 | 8 | 3 | ||
| 5 | 27 | 4 | 3 | 66 |
| 6 | 7 | 5 | ||
| 7 | 25 | 6 | ||
| 8 | 7 | 7 | ||
| 3 | 5 | – | 4 | 61 |
| 10 | 41 | 3 | ||
| 11 | 5 | 10 | ||
| 12 | 10 | 8,11 |
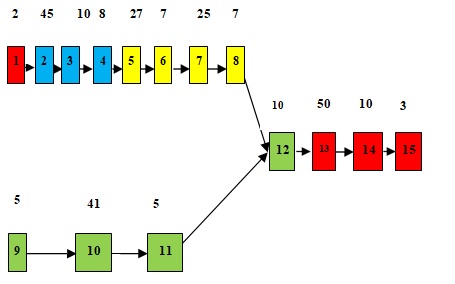
Fig. 3 Precedence diagrams for largest candidate method
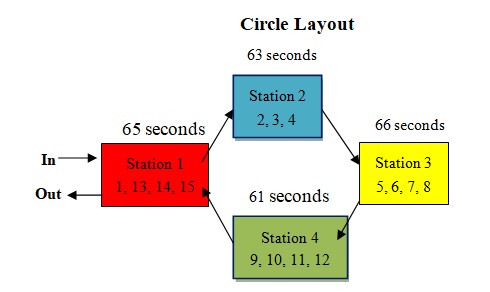
Fig. 4 Configuration layouts for a manual assembly line following LCR method
TABLE IV WORK ELEMENTS ARRANGED ACCORDING TO STATIONS
| Station 1 (1, 13, 14, 15) | 1. Load 6
13. Screwing and adjusting 14. Cleaning the Grease 15. Unload |
|
Station 2 (2, 3, 4) |
2. Grease inside 6 3. 11 in 6
4. 5 inside 11 and Grease |
| Station 3 (5, 6, 7, 8) | 5. 1a inside 5 and Grease
6. 4 inside 1a and Grease 7. 1b inside 4 and Grease 8. 2 inside 1b and Grease |
| Station 4 (3, 10, 11, 12) | 3. 3 inside 3 and Grease
10. 7 over 3 and screwed 11. 1 – 8 with 3 – 11 12. 2 inside 1b and Grease |
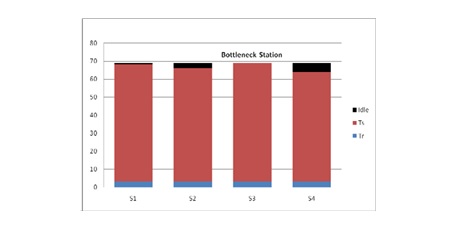
Fig. 5 Components of cyclic time at several stations on a manual assembly line LCR method showing that at the slowest station, the bottleneck station, idle time = zero; where Ts = maximum allowable service time, Tr = repositioning time
B. Kilbridge and Wester Column Method(KWM)
Work elements in this method are selected for assignment to stations according to their position in the precedence diagram, Tables 5 and 6. Therefore work elements were arranged into columns, Figure 6, and then organized into a list according to their column, with the elements in the first column listed first. Table 5 shows a list of elements of the column method, starting with the highest value of the time for each column.
The advantage of this method is that a given element could be located in more than one column. Fore example all of the columns for that element are to be listed as the case for Element 11. Consequently, repeating the previous steps for as many additional stations as possible until all elements have been assigned as shown in the precedence diagram, Fig. 6. Work stations arrangement is shown in Table 7. The work elements are the idle time was determined to be zero second for Station 3 and 3 seconds for Stations 1, 2 and 3, Fig.8. In this case, Station 3 is the bottleneck station, and each other station has same idle time.
TABLE V WORK ELEMENTS ASSIGNED AS STATIONS ACCORDING TO THE COLUMN METHOD
elem. Tek sec. Column preceding By
| 3 | 5 | A | – |
| 1 | 2 | A | – |
| 2 | 45 | B | 1 |
| 10 | 41 | B | 3 |
| 3 | 10 | C | 2 |
| 11 | 5 | C–H | 10 |
| 4 | 8 | D | 3 |
| 5 | 27 | E | 4 |
| 6 | 7 | F | 5 |
| 7 | 25 | G | 6 |
| 8 | 7 | H | 7 |
| 12 | 10 | I | 8,11 |
| 13 | 50 | J | 12 |
| 14 | 10 | K | 13 |
| 15 | 3 | L | 14 |
TABLE VI WORK ELEMENTS ARRANGED ACCORDING TO TEK VALUES FOR THE COLUMN METHOD
elem. Tek sec. column preceding By Station No. station Time sec
| 3 | 5 | A | – | 1 | 63 |
| 10 | 41 | B | 3 | ||
| 11 | 5 | C—H | 10 | ||
| 12 | 10 | I | 8,11 | ||
| 1 | 2 | A | – | ||
| 2 | 45 | B | 1 | 2 | 63 |
| 3 | 10 | C | 2 | ||
| 4 | 8 | D | 3 | ||
| 5 | 27 | E | 4 | 3 | 66 |
| 6 | 7 | F | 5 | ||
| 7 | 25 | G | 6 | ||
| 8 | 7 | H | 7 | ||
| 13 | 50 | J | 12 | 4 | 63 |
| 14 | 10 | K | 13 | ||
| 15 | 3 | L | 14 |
Precedence Diagram Columns
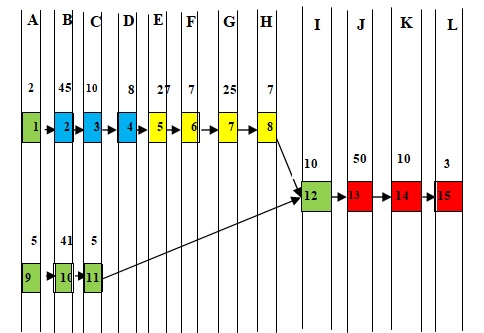
Fig. 6 Work elements arranged into columns for the Kilbridge and Wester method
Circle+ Straight Layout
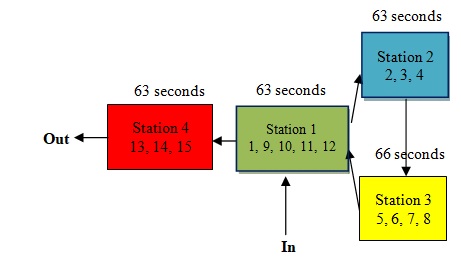
Fig. 7 Configuration layouts for a manual assembly line following Column method
TABLE VII WORK ELEMENTS ARRANGED ACCORDING TO STATIONS
|
Station 1 (1, 3, 10, 11, 12) |
1. Load 6
3. 3 inside 3 and Grease 10. 7 over 3 and screwed 11. 1 – 8 with 3 – 11 12. 2 inside 1b and Grease |
| Station 2
(2, 3, 4) |
2. Grease inside 6 3. 11 in 6
4. 5 inside 11 and Grease |
|
Station 3 (5, 6, 7, 8) |
5. 1a inside 5 and Grease
6. 4 inside 1a and Grease 7. 1b inside 4 and Grease 8. 2 inside 1b and Grease |
|
Station 4 (13, 14, 15) |
13. Screwing and adjusting
14. Cleaning the Grease 15. Unload |
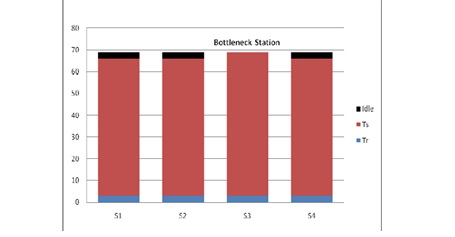
Fig. 8 Components of cyclic time at several stations on a manual assembly line Column method showing that at the slowest station, the bottleneck station, idle time = zero; where Ts = maximum allowable service time, Tr = repositioning time
C. Ranked Positional Weight Method (RPW)
The ranked positional weight method used and computed for each element. The method accounted for Tek value and its position in the precedence diagram (Figure 9). The RPWk is calculated by summing Tek and the other times for elements that follow Tek in the arrow chain of the precedence diagram Table (8). Then rearrange the values of time using the previous steps, work elements are listed according to RPW value in Table (9). Assignment of elements to stations proceeds with the solution is shown in Figure 10. The idle time was determined to be zero second for Station 2 with 1, 5 and 3 seconds for stations 1, 3 and 4 respectively, Figure 11. In this case, Station 2 is the bottleneck station.
Precedence Diagram
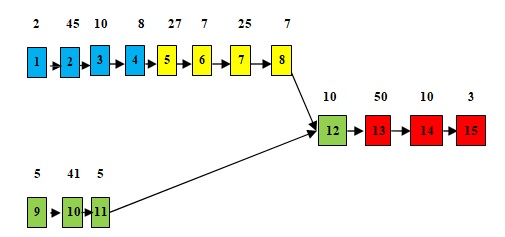
Fig. 9 precedence diagrams for RPW method
Straight Line Layout
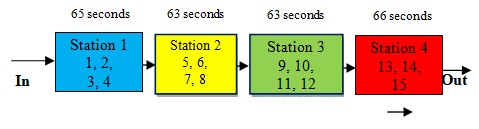
Fig. 10 A schematic diagram showing the distribution of station along a straight line
TABLE VIII WORK ELEMENTS ASSIGNED AS STATIONS ACCORDING TO THE RPW
elem. Tek sec. preceding By RPW
| 1 | 2 | – | 204 |
| 2 | 45 | 1 | 202 |
| 3 | 10 | 2 | 157 |
| 4 | 8 | 3 | 147 |
| 5 | 27 | 4 | 133 |
| 3 | 5 | – | 124 |
| 10 | 41 | 3 | 113 |
| 6 | 7 | 5 | 112 |
| 7 | 25 | 6 | 105 |
| 8 | 7 | 7 | 80 |
| 11 | 5 | 10 | 78 |
| 12 | 10 | 8,11 | 73 |
| 13 | 50 | 12 | 63 |
| 14 | 10 | 13 | 13 |
| 15 | 3 | 14 | 3 |
TABLE IX WORK ELEMENTS ARRANGED ACCORDING TO TEK VALUES FOR THE RPW
elem. Tek sec. preceding By Station No. station Time sec
| 1 | 2 | – | 1 | 65 |
| 2 | 45 | 1 | ||
| 3 | 10 | 2 | ||
| 4 | 8 | 3 | ||
| 5 | 27 | 4 | 2 | 66 |
| 6 | 7 | 5 | ||
| 7 | 25 | 6 | ||
| 8 | 7 | 7 | ||
| 3 | 5 | – | 3 | 61 |
| 10 | 41 | 3 | ||
| 11 | 5 | 10 | ||
| 12 | 10 | 8,11 | ||
| 13 | 50 | 12 | 4 | 63 |
| 14 | 10 | 13 | ||
| 15 | 3 | 14 |
TABLE X WORK ELEMENTS ARRANGED ACCORDING TO STATIONS
| 1. Load 6 | |
| Station 1 | 2. Grease inside 6 |
| (1, 2, 3, 4) | 3. 11 in 6 |
| 4. 5 inside 11 and Grease | |
| 5. 1a inside 5 and Grease | |
| Station 2 | 6. 4 inside 1a and Grease |
| (5, 6, 7, 8) | 7. 1b inside 4 and Grease |
| 8. 2 inside 1b and Grease | |
| 3.inside 3 and Grease | |
| Station 3 | 10. 7 over 3 and screwed |
| (3, 10, 11, 12) | 11. 1 – 8 with 3 – 11 |
| 12. 2 inside 1b and Grease | |
| Station 4
(13, 14, 15) |
13. Screwing and adjusting
14. Cleaning the Grease 15. Unload |
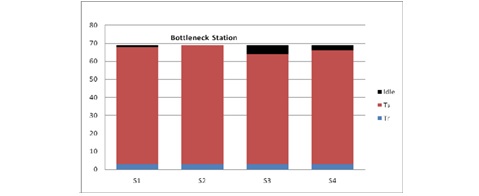
Fig. 11 Components of cyclic time at several stations on a manual assembly line RPW method showing that at the slowest station, the bottleneck station, idle time = zero; where Ts = maximum allowable service time , Tr = repositioning time
D. Production Rate
Manually assembling two stages gearbox to be produced on a single model assembly line necessitates the understanding of the Annual Demand (Da) or number of workers in order to establish the cycle time (Tc) value. The proposed annual demand set to be = 100,000 unit/yr with the assumption that the plant operates 50 weeks per year, 5 days per week and 8 hours per day the required production rate is:
Based on equation (3)
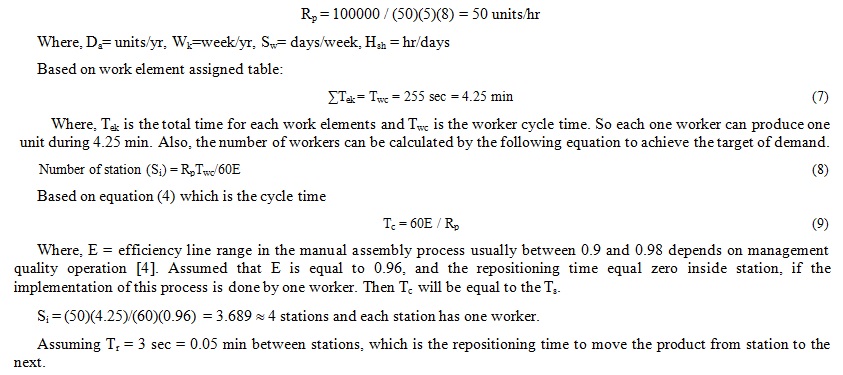
Calculation of the service time for the production line in order to reposition the worker or the work unit or both is:
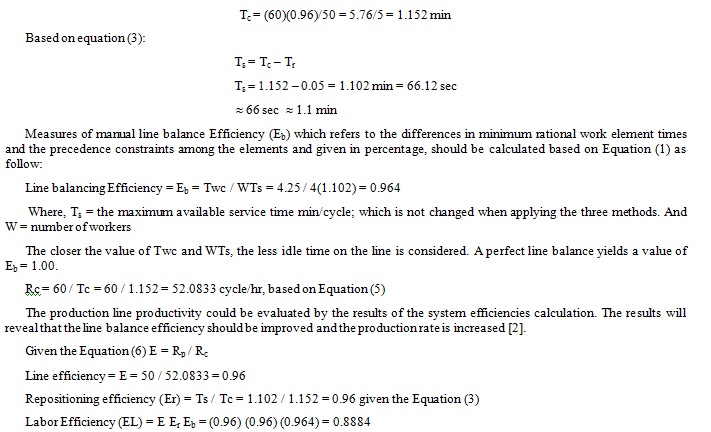
The efficiencies calculation results give perfect indications of production line productivity for this study. It is highly recommended that all the required elements and tools should be available at the workstation as well as the product should be moved at a constant velocity and time.
6. CONCLUSION
This study proposed three facilities designs in which the 2SGB to be assembled. Moreover the author developed three assembly line processing layouts following the single straight line, circle and mixed (circle + straight) processing RPW, LCR and KWM respectively.
It ultimates the rate of production in the three approaches assorted layouts as a reference is veritably. This is to determine which layout can provide better performance and the required selling cost. The best layout of product found is the line stations layout by Ranked Positional Weight Method, that represent total time per piece of 4.25 min and number of workstations is 4 stations, each station has one worker, as well found the service time of the production line in order to reposition the worker, the work unit, or both of 1.1 min, Line balancing Efficiency is 0.964 and Labor Efficiency is 0.8884.
7. RECOMMENDATIONS FOR FURTHER RSEARCH
The recommendation for further research can be focusing on calculation of time for each workstation in all line layout where the time effect on workstation location in the line. Also it is recommended to calculate cost effecting in the selection of better method as Bicriteria selection.
REFERENCES
- V. Minzu, and J-M. Henrioud (1997), “Assignment stochastic algorithm in multi-product assembly lines,” In: Proceedings of ISATP’37, pp. 103-114, IEEE Press.
- Z. Matondang and M. I. Jambak (2010) “Soft Computing in Optimizing Assembly Lines Balancing Journal of Computer Science,” 6 (2): 141-162, ISSN 1549-3636 © 2010 Science Publications.
- N Ismail, R. Esmaeilian, M. Hamedi, and S. Sulaiman (2011) “Balancing of parallel assembly lines with mixed-model product,” International Conference on Management and Artificial Intelligence IPEDR Vol.6 IACSIT Press, Bali, Indonesia pp (120-124).
- M.P. Groover, (2008), “Automation, Production Systems, and Computer-Integrated Manufacturing,” 3rd Edition, ISBN: 0132070731. USA.
- W. B. Helgeson, and D. P. Birnie (1961), “Assembly line balancing using the ranked positional weight technique,” J. Ind. Engng, 12 (6), 334-338.
- Dwivedi (2012) “An Analysis and Development of Software for Assembly Line Balancing Problem of Manufacturing Industry,” VSRD international Journal of Mechanical, Automobile & production Engineering, Vol. 2 (2), 74-87.
- E., Meyers, M.P. Stephens (2005), “Manufacturing Facilities Design and Material Handling,” 3rd. Ed. Upper Saddle: Prentice Hall.
- G. Pinto and B. M. Khumawala (1983), “Assembly line balancing with processing alternatives,” an application. Management Science, 23, 817-830.
- Malakooti, and A. Kumar, (1996), “Knowledge-based system for solving multi objective assembly line balancing problems,” International Journal of Production Research, Vol. 34, No. 3, pp. 2533-2552.
- J Carnahan,., M.S. Redfen and B.A. Norman (1999), “Incorporating physical demand criteria into assembly line balancing,” Pittsburgh University, Internal Report TR33-8.
- Bukchin, and M. Tzur (2000), “Design of flexible assembly line to minimize equipment cost,” IIE Transactions, 32, 585-598.
- Mat, Z. Muhamad, and C. Law (2002), “Work Improvement at a Car Manufacturing Company,” Jurnal Teknology, (36A), 55-63.
- Kamlekar1, R.C. Gupta, and A. Dalpati (2012), “Implementation of Assembly Line Balancing in a Labour Intensive Manufacturing Unit,” National Conference on Emerging Challenges for Sustainable Business, PP 1720-1730.
- Mahto, A Kumar (2012), “An Empirical Investigation of Assembly Line Balancing Techniques and Optimized Implementation Approach for Efficiency Improvements,” Global Journal of Researches in Engineering Mechanical and Mechanics Engineering Volume 12 Issue 3 Version 1.0 Publisher: Global Journals Inc. (USA) Online ISSN: 2249-4596 Print ISSN:0975-5861.
- Bukchin, and M. Tzur (2000), “Design of flexible assembly line to minimize equipment cost,” IIE Transactions, 32, 585-538.
- Vatkar (2007), “Design of a Two Stage Epicyclic Gearbox in a Sintered Metal Gears,” Master of Science, Wichita State University, Department of Mechanical Engineering, India.
