

- Case StudyHelp.com
- Sample Questions
Case Study on Amazon, Apple, Facebook and Google – Harvard Business School
Words: 2500
Get Case Study Solution Amazon, Apple, Facebook and Google by Best & Professional Experts? Casestudyhelp.com Provide Amazon, Apple, Facebook, and Google Case Study Help at an affordable price in Australia, the UK, USA and Worldwide. Casestudyhelp.com is the perfect solution for K12 to PhD students who need case study solutions assistance. Our qualified, skilled writers take minimum time to complete your order.

Task: Please read the attached case study and discuss with your colleagues the way the “big 4” impact your daily personal and professional lives.
As an additional point of discussion, allowing you to quickly deep your toes into “independent research”, consider whether the situation described in the case study is still relevant today – has the field changed in any way?
The Internet had not been designed as a marketing platform. On the contrary, until about 1995 commercial firms were banned from using its main data routes.1 It had begun as a defense project in the 1950s to create a nuclear bomber early warning system, and evolved into the Department of Defense’s Advanced Research Projects Agency Network (ARPANET.) It eventually expanded to become a global system, but with membership restricted to universities and scientific research laboratories.
Congress effectively privatized the Internet in 1995. The result was an explosion of innovation, much of it focused on four core marketing tasks: lead generation, transaction, information sharing, and persuasion. Premature optimism about the Internet’s potential to revolutionize marketing practice led to the so-called dot-com bubble from 1997 to 2000, but by 2013 Internet-based platform companies were taken-for-granted parts of marketing infrastructure.
Four companies in particular, capitalized at close to $1 trillion (Exhibit 1), ruled four sectors of Internet marketing. Online advertising was dominated by Google, online retailing by Amazon, social engagement by Facebook, and Apple set standards for the interface devices that were being called “the remote controls for many people’s digital lives.”
But there was no orderly division of the spoils of market-making among the four. Each hoped to be the one to claim its soul and skirmishes were fought on each of the sector boundaries as well as in new sectors (Exhibit 2). Google and Facebook competed for dominance of online advertising. Apple’s iTunes and Google Play challenged Amazon over retailing of digital content. Apple and Google fought to run the smartphone. Digital television was contested by Apple, Google, and Amazon. Google seemed to have a head start in payment systems and potentially banking, but Apple was likely close behind.
Throughout the field of online marketing, from distribution to communication to digital product formats to, ultimately, the power to set prices, there were battles for standards, and any one of the four could imagine being the one to establish dominant designs for all of online marketing.
The Modern Era Begins: Amazon Becomes Profitable
While the start of the commercial use of the Internet might be dated to the launch of the Netscape browser, or AOL, or Yahoo! portals in the early 1990s, the contemporary landscape began to take shape when Amazon, which had begun operations in 1995 as an online bookstore, turned in a $5 million profit in December 2001, reversing six years of losses. As 2013 began its global annual revenues were about $57 billion. Books together with digital media were 37% of net revenues. General merchandise accounted for 59% and fees for Amazon Web Services and credit card payments contributed about 4%.
Although Amazon Web Services was making a modest contribution to reported revenues, it represented a radical departure from conventional online retailing practice. It was launched in 2002 to place a suite of cloud computing services at the disposal of manufacturers seeking to reach Amazon’s online marketplace, but soon expanded to offer cloud computing services to many firms that were not part of its retail supply chain, hosting for example, information technology services for Dropbox, Reddit, and the New York Times. It framed the offering as elastic information technology infrastructure services, supplied flexibly as the businesses demanded them, and asking for payment only for what was used. A pharmaceutical company could rent computing capacity to execute large- scale simulations, a media company could stream videos or music to customers, and an enterprise could stream training videos to its workforce. These outsourcing offerings, while not core to Amazon’s business, gave it scale in the information technology that was core.
Web Services was not simply a way to achieve scale in technology. It expanded the assortment offered on its website and gave Amazon visibility into the sales of retailers who shared its platform. In the digital camera category, for example, Amazon’s assortment of stock keeping units (SKUs) compared to on- and offline competitors was as follows:
| Walmart Stores | 30 |
| Target.com | 210 |
| Walmart.com | 408 |
| Amazon | 8010 (of which 450 were directly retailed by Amazon) |
All 8010 SKUs were available to be returned in response to a shopper query, and if the shopper showed interest in one but did not buy, it could, at Amazon’s discretion, be made the subject of a retargeting advertising campaign.
By 2013, Amazon was the giant of the e-retailing world. Its $31 billion of U.S. retail revenue comprised close to a fifth of the sum of revenues of the next 100 U. S. online retailers. But e-retailing had not yet penetrated U. S. retailing deeply. If automotive sales were included, U. S. off-and online retailing summed to $5 trillion.
Marketing and advertising on behalf of its suppliers had long been elements of Amazon’s business model: a collaborative filtering tool, for example, would tell customers, “customers who bought X also bought Y.” But in 2011 Amazon launched an advertising network that by 2012 was described by AdWeek as advertising’s sleeping giant.6 A visitor browsing on Amazon and showing interest in a particular product, but failing to buy, would be tagged with a tracking cookie on their browser. Later, when they were elsewhere on a network of websites, they might be shown advertising for the overlooked product and an opportunity to buy it.
Amazon was expected to launch a smartphone in 2013 that would support the practice known as showrooming, in which consumers would visit physical stores to compare and try out products and then buy them online.
Then Came Google
Before 1998, most web users began their Internet visits at portals such as Yahoo, AOL, or Microsoft’s MSN. They browsed content sites linked from the portal home page or used its proprietary search tool to move on to other web content sites. The portals earned revenue by showing display ads to the traffic, so they rated content by its ability to detain traffic, referred to as its “stickiness.” Search, at that time, was just one of the services used to attract traffic to the portal and because it was not sticky, it was not considered important.
Google was an anomaly. When it launched in 1998, its website offered nothing but search and therefore earned no revenue. But the Google site was merely a demonstration project to show the power of its search algorithm, which it hoped to license to portals. In June 2000, the strategy met with success when Yahoo chose Google as its search engine. The win boosted Google’s stream of queries, supplying new data to train the search algorithm. It also provoked Google to find a way to profit directly from the increase in search traffic, not just indirectly through licensing fees.
In November 2000, therefore, Google began to sell text advertising on the right hand side of the results pages of searches (termed text boxes) to advertisers who wanted to reach consumers who were searching for particular keywords. It branded the service AdWords and priced it as a function of the number of people who clicked on the text box. Armed with a service that made money from traffic, it set out to find more traffic.
In June 2003, Google introduced AdSense, which allowed it to serve advertising not just on the search results of Google and its portal partners, but on any contextually relevant website across the entire Internet. Suddenly Google had an incentive to grow not only its share of Web searching, but also the amount of content on the Web itself. It launched a free webmail service, Gmail, that became a medium on which to place ads matching the content of particular email messages. In December 2004 it set out to scan and index all the world’s books. Froogle, Blogger, Picassa, a calendar service, a translator, and dozens of other content sites began to flow from a combination of Google’s product development and acquisitions teams.
It made a very big content acquisition in October 2006, when it bought YouTube, a video storage and distribution site, for $1.65 billion. YouTube did not charge either uploaders or viewers of video, but earned revenue from advertising. It later introduced premium content channels, a move that began to position YouTube as a competitor to cable television.
In April 2007, it made an even more costly acquisition, this time to improve ad serving efficiency rather than scope, when it bought DoubleClick, the dominant online ad serving platform, for $3.1 billion. In a similar vein it later bought AdMob, the dominant server of ads to mobile devices.
Soon a number of changes began to appear on Google’s search results pages whose effect was that for the first time Google could earn revenue not just from advertising on the right hand side of its results pages but from the lists on the left side. After Google bought ITA, whose software searched for airline seats, Google began to serve up a matrix of flight and fare information to flyers and was paid an affiliate fee from travel websites when people clicked to book flights. Results not generated by the search algorithm (sometimes termed hard-coded results) also began to appear at the top of lists for other kinds of search: finance, health, movies, maps, and news.
Then Google set a course that, at first glance, seemed tangential to the ad-based course it had followed until that point. It launched the Android mobile phone operating system in November 2007 which, because the software was free, had no obvious revenue model. Then, in August 2011, Google made its largest ever acquisition, paying $12.5 billion for Motorola Mobility, a manufacturer of mobile handsets. It allowed Google to build phones as proof of concept for the Android operating system.
In November 2011, it launched Google Play, an online music storage and purchasing service with functionality similar to elements of iTunes. At about the same time it launched Google Wallet, which allowed the smartphone to be used as a payment system. It began working with retailers to offer a service competitive with Amazon to find customers through search and was expected to be launching same-day delivery soon. In the same year, it launched Google +, a social network integrated with its search, photo and video offerings. A year later, it had only 20% of the unique monthly users that Facebook had and was holding its users for 3 minutes a month compared to Facebook’s 400 minutes. Many of those users had joined only because Google was requiring a Google + account as a condition for creating an account with Gmail, YouTube, or Zagat. A Google + account profile included name and address, interests and preferences, and in many cases a list of friends, so it supplied profiling data for advertisers.
By the end of 2012, despite more than a decade of fast-paced innovation beyond search, Google still made most of its profits from search. Advertising made up about 97% of Google’s $43 billion gross revenues, 69% from ads on Google’s own websites (mainly search ads on its search site, and display ads on YouTube and its 260 million Gmail accounts) and 28% from ads on third-party publisher sites (mainly display ads). The revenue from ads on Google sites accrued entirely to Google, while about 60% of the revenue from ads on third party sites was paid to the third parties, so Google’s operating income relied disproportionately on ads served on its search engine. About half of Google’s revenue was earned from US advertisers.
Apple Enters the Internet Economy
Apple Inc. was founded in 1976. As recently as 2004 its market capitalization was $8 billion, but in a period from January 2009 to the start of 2013 it grew from $75 billion to $600 billion to become the most valuable U. S. public company of all time.8 It had evolved from a manufacturer of hardware for the pre-Internet age to an enterprise that investors appraised to be a leader in the Internet economy.
The precise trigger for this sharp reappraisal was often debated. The timing of no single change in management, shift in revenues, or new product offering, fully explained the 2009 take-off. Founder Steve Jobs had returned to lead the company in 1997 after a period in exile. The iTunes software and the complementary iPod music player were launched in 2001 but did not materially lift revenues. The iPhone was launched in 2007 and the iPad in 2010. While revenues by 2012 depended heavily on retail sales of the latter two devices, optimism regarding the company’s prospects in the digital economy seemed to rest more on the seamlessness and elegance of the devices’ integration with the Internet than its success solely as a device manufacturer.
While Google’s Android was the dominant operating system on mobile devices internationally, installed on 72% of phones sold in the third quarter of 20129, Apple led Google in mobile e-commerce access. Apple’s iOS operating system was, in 2012, the system by which most people accessed the mobile Web, while Android devices had less than 20%. The major e-commerce retailers such as Amazon and Target received almost 10% of their traffic from mobile devices and the iOS system sent substantially more than did the Android system.
Another battle for control of access to e-commerce was playing out between Amazon’s Kindle platform, for distributing and viewing digital content, and Apple’s combination of iTunes and iPad. While the Kindle was optimized for books, the iPad hoped to be a good-enough solution to a broader range of digital content. In the battle with Google for search, its voice-activated search tool Siri posed a challenge.
Smartphone applications, or apps, played an important role in online marketing. They allowed mobile devices to host customized applications and/or combine content stored on the user’s device with Internet resources to manage interactions with a wide variety of commercial services such as banking, travel, shopping, local information, news, video, sports, blogs, games, social media, maps, and music. Here too Apple led Google. Of all the apps downloaded since Apple and Google began distributing them in the second half of 2008, Apple had been the source of 60%.
Facebook Transforms the Internet Experience
Facebook had been available to the general public since 2005, but its dominance of the American online experience was a more recent phenomenon. It did not begin to grow until about 2009 (see Exhibit 3). In just two years, its share grew with the intensity of an epidemic from 2% to 20% of the time Americans spent online, as both the size of its audience and the hours they spent on the site grew.
In the United States, by 2013, 153 million people were visiting Facebook at least once per month, comprising nearly three quarters of all those who went online. In that month the average Facebook visitor gave 6 hours and 41 minutes to the site. More people visited Google but they spent far less time (1 hour and 54 minutes) (Exhibit 4). The Internet as a whole occupied 28 hours per month of the lives of each of the 212 million Americans who went online each month (Exhibit 5). Television, by comparison, occupied 168 hours per month of the lives of the 292 million people who watched television (158 hours in real time and 9.5 hours time shifted.)
When time spent on Facebook was combined with time on other social networks and blogs, the social networking category accounted for a quarter of all time spent online, double that of online games and more than double the time spent on email. In a month, 97% of users accessed social media from a computer and 37% accessed from a mobile phone. The social media population was broadly representative of the online population generally, with a slight bias to the 18-34 age group (8% over- indexed) and a slight bias against the over 65 age group (9% under-indexed).
Despite dominating time online, Facebook was slower to attract online advertisers than Google had been. It performed well in the $15 billion U.S. display advertising sector (Exhibit 7), where it was expected to generate $2.2 billion in 2012, compared to Google’s $2.3 billion. In 2012 it delivered one fifth of all display advertising impressions. But it had no significant presence in the $16 billion U.S. paid search market where Google earned $12 billion. Yet Facebook’s founder liked to claim that the social network was handling approximately a billion queries a day, “and we’re basically not even trying.”
In local retailing, Facebook offered a service on its mobile app that allowed users to discover local offline businesses informed by the experience of its friends. Its Gifts service was viewed by some as a beachhead into e-commerce.
Most of Facebook’s revenue, however, came from advertising. Facebook users could declare themselves to be fans of brands and celebrities by clicking the “like” button on the brand or celebrity’s Facebook page. Advertisers could buy the right to advertise on the pages of friends of a fan with a tag showing the name of the fan. The typical Facebook user had 229 friends, and friends reached by tagged ads tended to click-through to the advertiser’s site at two to three times the rate of friends exposed to untagged ads.13 In addition to such paid media exposures, advertisers could receive so-called shared media exposures if they could induce a Facebook user to pass on a brand impression to friends.
Late in 2012, Facebook launched its Facebook Exchange ad-bidding and retargeting network. Members of the Facebook Exchange network of websites could place a tracking cookie on the browser of a visitor to their site, and Facebook would contract to serve advertising to Facebook members when they logged in to Facebook. Because Facebook users tended to visit the social network very frequently, the interval between, for example, revealing interest in a product on Drugstore.com and visiting Facebook tended to be short, and early indications were that ads presented on Facebook tended to perform better than other retargeted ads. The potential existed to apply the system in reverse, although there was no evidence that it was yet. In reverse mode, Facebook members could be cookied when their postings on Facebook contained commercially actionable insights and display advertising could be delivered when those cookies appeared elsewhere on the Web. With 50% of Facebook visits happening on mobile devices, which were inhospitable to advertising, reverse retargeting would allow Facebook to profit from advertising on other sites’ larger displays.
The Media Advertising Market
Offline, on television, radio, and print, U. S. advertisers spent about $174 billion annually on media advertising.14 The direct marketing market, including email and database marketing, was worth a further $169 billion.15 Online, by contrast, advertisers spent about $37 billion.
Many observers noted that online spending seemed to lag behind audience attention. Americans spent about 26% of their media time online, yet advertisers spent 20% of their media budgets online. The disparity between time spent accessing the Internet from a mobile device and advertising on a mobile device was even greater: 10% of media time contrasted with 1% of advertising.17 It was common in the online advertising industry to cite Kevin Kelly, founding editor of Wired Magazine, who had argued that “money follows attention,”18 and to conclude that online media markets were poised to grow strongly.
Online advertising spending in 2012 was distributed as follows (see Exhibits 7 and 8 for sources):
| Search advertising on desktops and laptops | |
| Paid search | $16.0 billion |
| Search advertising on mobile devices | |
| Paid search | $2.0 billion |
| Display advertising on desktops and laptops | |
| Banners | $8.0 billion |
| Digital video and rich media | $3.4 billion |
| Sponsorships and lead generation | $2.7 billion |
| Display advertising on mobile devices | |
| Advertising in applications (Apps) | $1.3 billion |
| Advertising on mobile websites | $0.5 billion |
| Classified (e.g. auto and real estate listings, job boards, auction listings, yellow pages) | $2.7 billion |
| Email (banners and links that appear in email newsletters and other commercial email) | $0.4 billion |
The Search Engine Advertising Market
Globally, more people used a search engine than any other category of software. 85% of the world’s Internet users (and 94% of U.S. users) used a search engine in 2011, compared to 64% for email (82% in the U.S.) The number of so-called core desktop searches in the U.S. (which excluded specialized searches on local directories and maps) had grown from 7 billion to nearly 18 billion in the five years to 2012, although the trend had flattened in the most recent year.19 (See Exhibit 9.)
U.S. desktop searches were dominated by Google, which held a market share of 66% from 2009 through 2012, even as competitor shares churned. Yahoo at 12% had lost share and Microsoft’s Bing had grown to 16% (Bing had powered the Yahoo searches since 2009). Ask had 3% and AOL (powered by Google) had 1.5%.20 Revenue from paid search on desktop search engines directly benefitted from five years of growth in core search volume and grew 17% year-on-year even in 2012.21 Google’s share of paid search advertising revenue had been substantially larger than its share of searches for this whole period.
Mobile searches grew as desktop searches slowed. After the launch of the Apple iPhone in 2007, desktop and laptop computers were no longer the only devices by which the Internet could be reached. By 2012, an average of 15% of searches originated on mobile devices. For restaurant searches the share was 30%. About 50% of social media visits occurred on mobile devices.
Google controlled almost all of the mobile search advertising market.22 Click-through to advertiser sites was lower than for desktops and laptops, but other actions such as offline store visits, offline sales, and phone calls to mobile advertisers performed well.
Specialized vertical search, from desk and mobile devices, had begun to be a factor in the search market in about 2007, with the rise of Yelp, a local directory and review service, TripAdvisor in travel and hotels, and restaurant review sites such as Zagat, OpenTable, and UrbanSpoon. These sites combined the comprehensiveness of a directory with relevance indicators from customer reviews and awareness of a searcher’s location.
As reviewers built reputations, and the sites built community elements, some observers speculated that search engines might be vulnerable to the trend toward search informed by the preferences of the searcher’s social network, most apparent in the rise of Facebook.
The Display Advertising Market
On offline media, advertisers liked to place ads alongside so-called “premium content” that matched the interests of their consumers. Thus financial services brands would advertise on the pages of the Wall Street Journal and household products on daytime television. Many web publishers, for example Yahoo and AOL, followed the offline logic. They built sites that curated high quality content that matched offline content categories, and others, for example iVillage and Slate.com, specialized in particular audience demographics.
Other web publishers put their faith in the idea that advertisers would buy “audiences,” not premium content. By audiences they meant viewers profiled by data describing their past actions or their profiles. Many services existed to attach viewer profile data to cookies on the viewer browsers, so that wherever the viewer went on the Internet, regardless of the content they chose to view, an advertiser who valued that viewer’s profile could deliver a display advertisement.
The latter kind of publisher sold display advertising at a far lower cost per exposure than premium content publishers because the volume of unsold advertising space on poorly trafficked websites was substantial, and the automated advertising exchanges and advertising networks that represented such publishers could match it to viewers without expensive sales forces. The largest of these advertising exchanges, AdX (formerly Doubleclick) was owned by Google. During 2012 the average cost per thousand exposures (CPM) of display advertising declined, suggesting that advertisers were tending to buy audiences rather than premium sites, and were satisfied with the results they were getting.
The Internet Retailing Market
Most retailing in the United States still took place offline. Depending on which categories of retail trade were included in the denominator, online retailing was as little as 5% of all retail or as much as 10% (if automotive, food, and furniture in particular were excluded.) However many retail transactions involved some search online, so that perhaps 15% of the most generous estimate of retail spending touched the Internet at some point.
By far the largest player was Amazon, with $48 billion in global online sales for 2011. The second largest online retailer was Apple Inc., with $15.8 billion in online sales for 2011 (Exhibit 10), attributable to iTunes music sales, digital software sales, and Internet-related equipment sales, such as desktop and laptop Macs computers, iPhones, iPods, and iPads. Staples was third on the list of top Internet retailers at $10.6 billion. Walmart was fourth at $5 billion for 2011 and Dell, Office Depot and QVC.com had sales of about $4 billion each.23 eBay was not usually classified as a retailer because it functioned as a platform for third party sellers, but if was so classified then it was second behind Amazon, with its sellers moving about $28 billion of products and services.
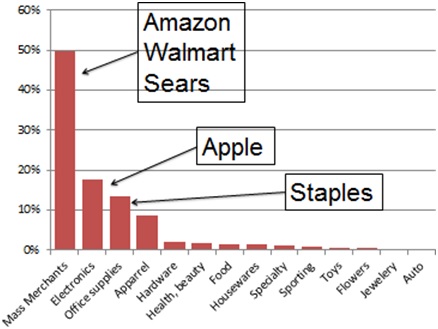
By category, online retailing was far more skewed toward general merchandise, and away from specialty merchants, than offline. Four general merchandise players in particular, Amazon, eBay, Wal-Mart and Sears, did 50% of the total of the top 100 retailers’ online sales. Electronics, which included Apple and Dell, was the second largest category at 18% of the top 100 online sales, and office supplies third. All three categories skewed above their share in offline retailing. Other categories, particularly apparel, health and beauty products, and food, skewed well below their offline share.
The distribution of sales per retailer among online retailers showed a very pronounced long tail. About 95% of the Internet Retailer top 500 retailers in 2011 were so small as to be barely viable. Quite well-recognized specialists such as Groupon ($1.6 billion), Etsy ($526 million), and GiltGroupe ($500 million) were of more interest as online prototypes than as models of success.
Conclusion
The Economist, in a December 2012 editorial, wrote that, “The four giants of the Internet age— Google, Apple, Facebook and Amazon—are extraordinary creatures. Never before has the world seen firms grow so fast or spread their tentacles so widely. . . The digital revolution these giants have helped foment has brought huge benefits to consumers and businesses, and promoted free speech and the spread of democracy along the way. Yet they provoke fear as well as wonder. Their size and speed can, if left unchecked, be used to choke off competition. . . The giants want to get consumers hooked on their own “platforms”—combinations of online services and apps that run on smartphones and tablet computers.”
To the marketing corporations that fed the advertising and e-commerce revenues over which the four giants of the Internet disputed, the outcome was of vital interest. Just as the automobile, shopping centers, and television networks had shaped consumer behavior in the 20th century, the capabilities of that era’s marketing experts, and the forms of its most successful marketing corporations, so the new platforms of marketing would play a part in shaping the winners and losers of the 21st century economy. Search engine marketing had revolutionized publishing, wounding newspapers and catalogs, but at breathtaking speed the desk-bound age was transitioning to one that relied on mobile devices. Would search survive? Browsers and portals had been the gateway to the web, but by 2013 many sessions began with a visit to a social network. How aggressively should marketing firms court the favors of social commerce platforms? E-commerce merchants were paying a toll to firms like Google and Yahoo to drive traffic to their online stores. Would the self-sufficient marketing systems of digital native merchants like Amazon let merchants bypass the tolls? Television, banking, and telecommunications too saw their consumers experimenting with new practices. The future of markets and marketing was never more fluid.
Exhibit 1 Apple, Amazon, Facebook and Google, Essential Statistics
|
Company |
Year Founded | Market capitalization
$bn |
Gross Margin | Revenue
$bn** |
Profit
$bn** |
Cash
$bn* |
Employ- ment* | |
| Amazon | 1994 | $110.7 | 25.3% | $57.3 | loss | $5.2 | 81,400 | |
| Apple | 1976 | $548.2 | 40.2% | $156.5 | $41.7 | $121.3 | 76,100 | |
| 2004 | $56.9 | 74.5% | $4.6 | loss | $10.5 | 4,331 | ||
| 1998 | $222.8 | 53.7% | $47.5 | $10.6 | $46.8 | 53,546 |
Exhibit 2 Amazon, Apple, Facebook and Google commerce and advertising features
| Amazon | Apple | |||
| Search capability | Limited | via Siri | Rumored | Dominant |
| Social capability | Reviews | Integrates with others | Dominant | Google+ |
| Retail capability | Dominant | via iTunes | Gifts | via Wallet and Places |
| Television capability | Streaming via Web Services | Apple TV | None | Google TV |
| Smartphone capability | Rumored | iOS | Rumored | Android |
| Payment system capability | None beyond credit card | Rumored | None | Google Wallet |
| Advertising network | Real time ad system | iAd | Facebook Exchange | Dominant |
Exhibit 3 Facebook’s Share of Hours per Week Spent Online in the United States
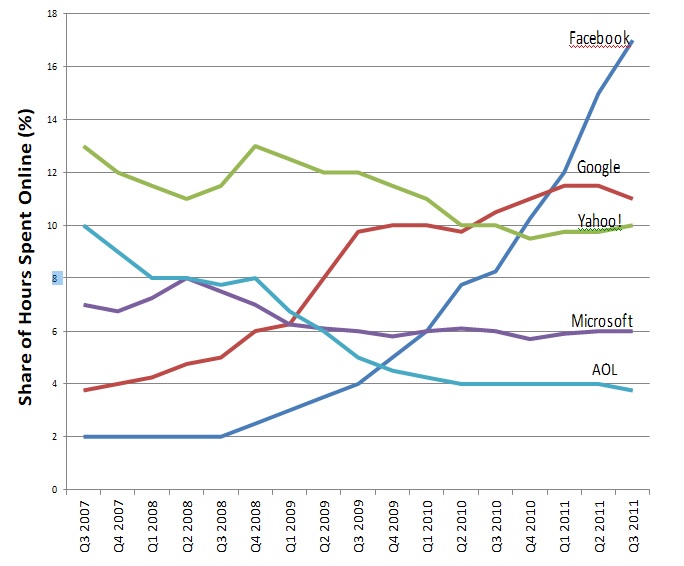
Exhibit 4 Top Ten U. S. Web Brands Ranked by Unique Monthly U.S. Visitors on Desktop and Mobile Devices, September 2012
Rank Brand Unique visitors (000) Time per Person (hh:mm)
| 1 | 175,000 | 1:54 | |
| 2 | 153,000 | 6:41 | |
| 3 | Yahoo | 140,000 | 2:21 |
| 4 | YouTube | 131,000 | 1:45 |
| 5 | MSN/Bing | 125,000 | 1:14 |
| 6 | Microsoft | 89,000 | 0:43 |
| 7 | AOL | 88,000 | 2:15 |
| 8 | Amazon | 80,000 | 0:35 |
| 9 | Wikipedia | 78,000 | 0:19 |
| 10 | Ask | 75,000 | 0:12 |
Exhibit 5 US Internet Use from all Devices for September 2012
# of People Who had Internet Access 278,570,000 # of People Who Went Online 212,172,000
The following averages apply to the 210 million U.S. individuals who went online to the sites of the top ten Web brands from PCs and mobile devices during September 2012.
Sessions/Visits per Person 63
Domains Visited per Person 95
Web Page Views per Person 2,563 Duration of a Web Page viewed 0:01:00 Online Time per Person 28:32
Exhibit 6 U.S. Internet Use from PCs and Mobile Devices for July 2012
# of People Who Went Online:
on a Personal Computer 204,721,000 (down 4% year on year)
on a Mobile App 101,802,000 (up 85% year on year)
on a Mobile Website 95,176,000 (up 82% year on year)
Duration of visits (minutes per user):
Personal Computer visits 28.6 hours
Mobile App visits 21.2 hours
Mobile Website visits 4.9 hours
Exhibit 7 U. S. Mobile Search and Display Advertising 2012
Advertising on mobile devices (phones and tablets) trebled between 2011 and 2012, and is estimated at $3.8 billion for 2012. It comprises more than 10% of all online advertising.
US Mobile Search Ad Revenues on Search Engines, 2012
| 93.3% | |
| All other | 6.7% |
| Total (billions) | $2.0 |
US Mobile Display Ad Revenues at Top 4 Sites, 2012
| 18.4% | |
| 17.0% | |
| Pandora | 12.2% |
| 7.3% | |
| Total Top 5 | 54.9% |
| Total (billions) | $1.8 |
Exhibit 8 Search and Display Advertising, United States 2012
We estimate the total of U. S. Internet advertising expenditures for calendar 2012 to be $31 billion. The Interactive Advertising Bureau has two categories in its estimate of Internet advertising that we exclude. It counts email and classified and auction advertising, bringing its estimate to $34 billion.
Search expenditure comprises paid listings on desktop and mobile search engines, text links in articles, paid inclusions, and site optimization, as defined by the Interactive Advertising Bureau. Display expenditure comprises banners, rich media, digital video, and sponsorships on desktop and mobile websites as defined by the Interactive Advertising Bureau.
US Online Search Ad Revenues at Top 4 Search Engines, 2012
| 75.9% | |
| Microsoft | 7.9% |
| Yahoo | 7.9% |
| AOL | 1.7% |
| Total Top 4 | 93.5% |
| Total (billions) | $16.0 |
US Online Display Ad Revenues at Top 5 Sites, 2012
| 15.4% | |
| 14.4% | |
| Yahoo | 9.3% |
| Microsoft | 4.5% |
| AOL | 3.6% |
| Total Top 5 | 47.2% |
| Total (billions) | $15.0 |
Exhibit 9 Number of Desktop Web Searches per Month in the United States on Core Search Engines (Google, Yahoo!, Microsoft, Ask and AOL)
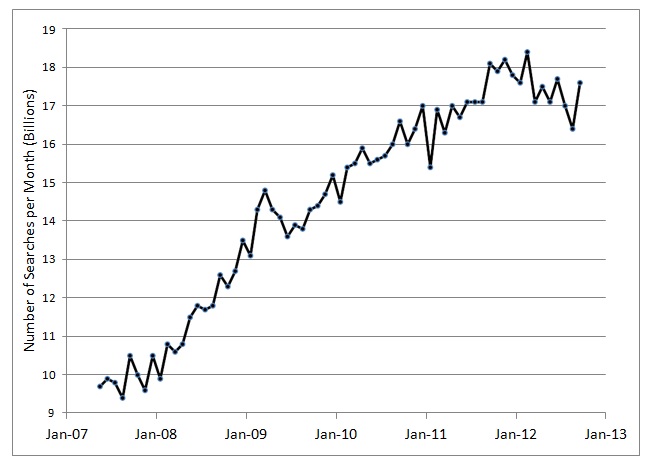
Exhibit 10 Retailing by category in U. S.
Endnotes
1 The NSFNET Backbone Services Acceptable Use Policy, June 1992, http://www.intercom.co.cr/internet/research/1992/06.htm, accessed January 3, 2013
2 “Battle of the Internet Giants,” The Economist (print edition), December 1, 2012.
3 Amazon.com Inc., Form 10-K, http://www.sec.gov/Archives/edgar/data/1018724/000119312512032846/d269317d10k.htm, accessed January 3, 2013
4 Personal communication from Professor Kinshuk Jerath, January 12, 2013. Data gathered by Professor Jerath on the Web and in the Pittsburgh area in April 2011.
5 Internet Retailer, Top500guide.com, accessed January 2, 2013
6 AdWeek, http://www.adweek.com/news/technology/amazon-advertisings-sleeping-giant-awaken-2013- 145964 accessed March 1, 2013.
7 Google Investor Relations, 2012 Financial Tables, http://investor.google.com/financial/tables.html, accessed January 3, 2013
8 Edward Krudy, “Apple becomes most valuable company of all time”, August 21, 2012, http://in.reuters.com/article/2012/08/21/idINL2E8JKC8C20120821, accessed January 3, 2013
9 Salvador Rodriguez, “Android accounted for 72% of worldwide Q3 smartphone sales”, Los Angeles Times, November 14, 2012, http://articles.latimes.com/2012/nov/14/business/la-fi-tn-android-smartphone-market-
share-20121114, accessed January 3, 2013
10 Henry Blodget, “Apple is Destroying Android in Mobile Web Usage”, June 1, 2012, http://www.businessinsider.com/apple-android-mobile-web-usage-2012-6, accessed January 3, 2013
11 Case writer research compiled from http://www.mobilestatistics.com/mobile-statistics, accessed January 3, 2013. Graph at aforementioned link shows that of the approximately 50 billion apps downloaded between 2008 and 2012 Blackberry’s platform was the source of ~2 billion, Android’s the source of ~15 billion, and Apple’s the source of ~30 billion, or 60% of all downloads.
12 Nick Bolton, “Facebook Changes Privacy Settings, Again”, December 12, 2012, http://bits.blogs.nytimes.com/2012/12/12/facebook-changes-privacy-settings-again/, accessed December 22, 2012.
13 Sankrant Sanu, “Higher Click-Through Rates on Facebook Ads Drive Advertisers And Revenue To The Social Network”, October 26, 2012, http://seekingalpha.com/article/953971-higher-click-through-rates-on- facebook-ads-drive-advertisers-and-revenue-to-the-social-network, accessed January 3, 2013
14 Plunkett Research, Advertising & Branding Industry Overview 2012, http://www.plunkettresearch.com/advertising-branding-market-research/industry-statistics, accessed December 19, 2012
15 Direct Marketing Association website, http://www.the-dma.org/aboutdma/whatisthedma.shtml, accessed December 22, 2012
16 eMarketer Report, “US Digital Ad Spending to Top $37 Billion in 2012 as Market Consolidates”, September 20, 2012, http://www.emarketer.com/newsroom/index.php/digital-ad-spending-top-37-billion-2012-market-
consolidates/, accessed January 3, 2013
17 Blog.eloqua.com/Internet-marketing-trends accessed December 18, 2012.
18 Kevin Kelly, “How Money Follows Attention – Eventually,” MIT Technology Review, October 28, 2010, http://www.technologyreview.com/news/421457/how-money-follows-attention—eventually/, accessed December 18, 2012
19 Company press release:“comScore Releases October 2012 U.S. Search Engine Rankings”, Nov.16, 2012, http://www.comscore.com/Insights/Press_Releases/2012/11/comScore_Releases_October_2012_U.S._Search_ Engine_Rankings, accessed January 3, 2013
20 ibid
21 Internet Advertising Revenue Report 2012 first six months results, Interactive Advertising Bureau, http://www.iab.net/media/file/IAB_Internet_Advertising_Revenue_Report_HY_2012.pdf, accessed January 3, 2013
22 Peter Cohan, “Click-To-Call: Google’s Key to 96% of Mobile Search Ad Market”, Forbes, October 29, 2012, http://www.forbes.com/sites/petercohan/2012/10/29/click-to-call-googles-key-to-96-of-mobile-search-ad- market/, accessed January 3, 2013
23 Internet Retailer 2011 report (adjusted by case writers for U.S. sales.)
24 Internet Retailer / www.top500guide.com
25 “Technology Giants At War: Another game of thrones”, The Economist, December 1, 2012, http://www.economist.com/news/21567361-google-apple-facebook-and-amazon-are-each-others-throats-all- sorts-ways-another-game, accessed January 3, 2013
For REF… Use: #getanswers2001766
